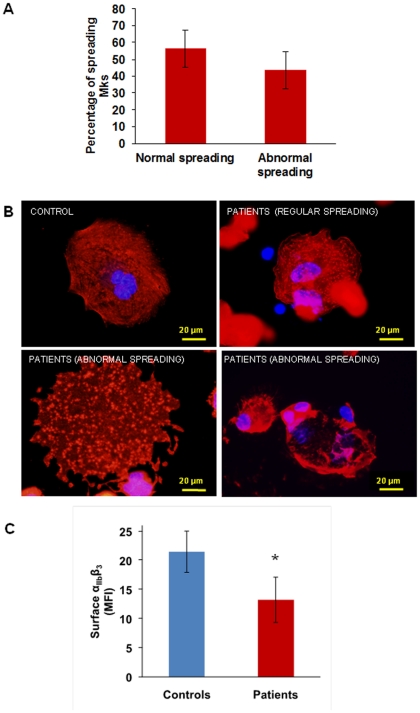
Figure 2. Megakaryocyte spreading on fibrinogen and αIIbβ3 expression.
(A) and (B) When plated on fibrinogen two populations of megakaryocytes are visible: half of the population spread regularly, while half showed abnormal spreading, with nuclei displayed towards cell periphery, a disordered distribution of actin and focal adhesion points more evident than stress fibres. (C) Flow cytometry showed decreased expression of αIIbβ3 on the surface of patient's megakaryocytes as compared with control megakaryocytes. *p<0.05 vs control.

