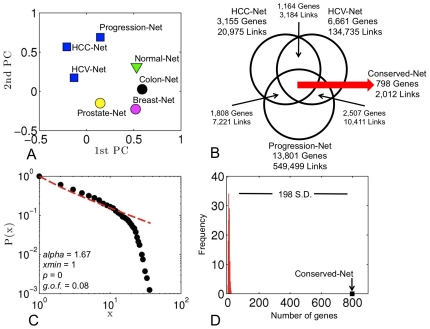
Figure 1. Properties of gene co-expression networks.
A) Principal component analysis (PCA) of connectivity patterns in HCC datasets and breast, colon, and prostate cancers as well as the normal human tissue. B) Venn diagram of conserved genes and links in three HCC datasets with different etiologies. C) The cumulative distribution function P(x) and the maximum likelihood power-law fit for the node degree distribution in the Conserved-Net. The alpha parameter represents the scaling exponent in the power-law fit, p(x)∼x−alpha, while xmin represents the lower cut-off for the scaling region. The corresponding p and goodness-of-fit (g.o.f.) values were computed according to the method described in [22]. The red line represents visualization of a power-law distribution of the form p(x)∼x−alpha for x≥xmin. D) Comparison of Conserved-Net to intersections of randomly generated networks.

