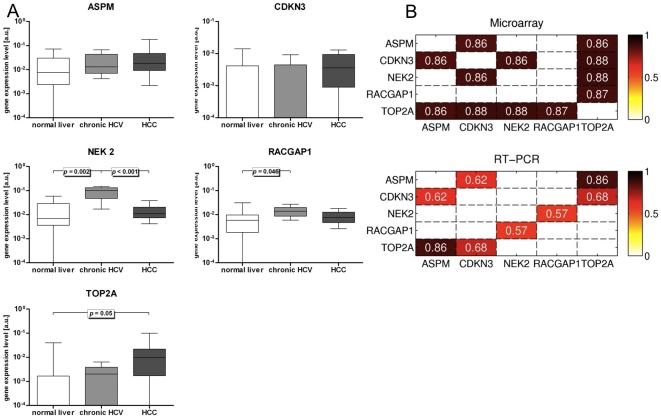
Figure 6. RT-PCR validation of co-expression links among topologically central genes in the ‘Cell cycle’ cluster of the Conserved-Net.
A) Expression of ASPM, CDKN3, NEK2, RACGAP1, and TOP2A. Illustrated P-values are based on pairwise comparisons by Mann-Whitney U tests, if global Kruskal-Wallis test revealed significant differences (p<0.05). B) Heatmaps visualizing comparison of average gene co-expressions in HCC microarray datasets with respective transcript co-expressions assessed using RT-PCR. Numbers on each heatmap represent Pearson Correlation Coefficients (PCC). Only statistically significant PCCs were reported for RT-PCR transcripts. P<0.05 was considered significant.

