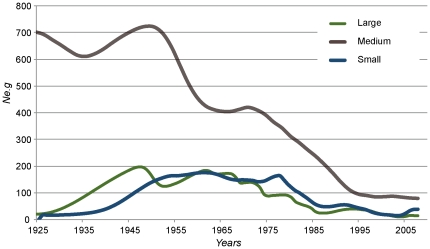
Figure 4. Bayesian skyride plot (BSP) for the three genomic segments of RVFV.
The effective population size times the generation time (Ne.g) parameter approximates the number of infections in time. The plots overlay indicated complex oscillations with higher viral activity starting at around 1930, culminating sometime between the 40's and 60's, followed by a steady decrease from the 70's to the present. The stabilization of near the present is consistent with enzooticism, since the virus is not kept in human populations.

