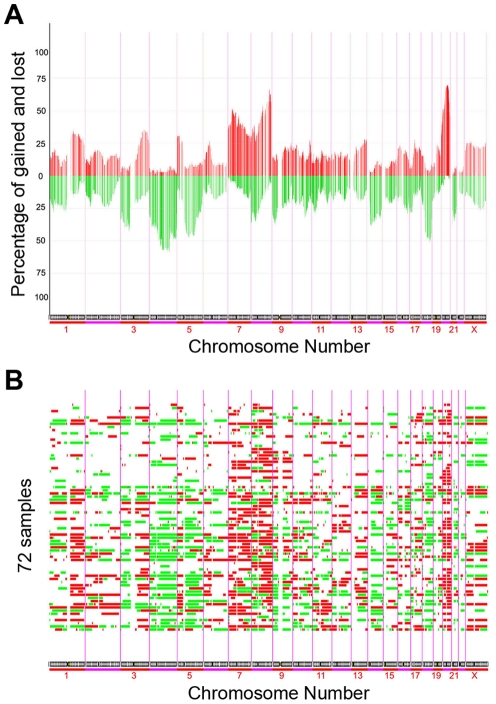
Figure 1. DNA copy number alterations by aCGH.
(A) Overall frequency of DNA copy number alterations by aCGH. Frequency analysis measured as a fraction of cases gained or lost over all the BAC clones on the arrays. Data presented was ordered by chromosomal map position of the clones. Lower bars represented losses and upper bars represented gains. The purple vertical bars represented the boundary between each chromosome. (B) DNA copy number alterations in each gastric cancer samples. 72 tumor samples were ordered from top to bottom. Red columns represented copy number gains and green columns represented copy number losses.

