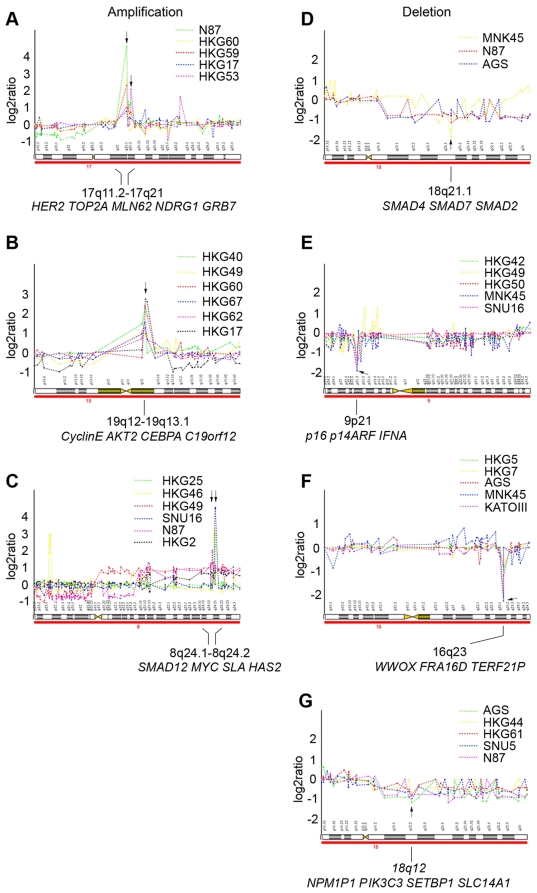
Figure 2. DNA copy number analysis of representative amplicons and homozygous deletions.
Clones were ordered by their position from pter (left) to qter (right). The log2 ratios of every clone in these specific cases were plotted as broken line graphs with different color. Multiple clear copy number changes (gains, losses, amplifications and deletions) can be recognized. The center of amplicon and homozygous deletion cores were indicated together with genes in each core region. (A) Amplification in 17q11.2–17q21. (B) Amplification in 19q12–19q13.1. (C) Amplification in 8q24.1–8q24.2. (D) Homozygous deletion in 18q21.1. (E) Homozygous deletion in 9p21. (F) Homozygous deletion in 16q23. (G) Homozygous deletion in 18q12.

