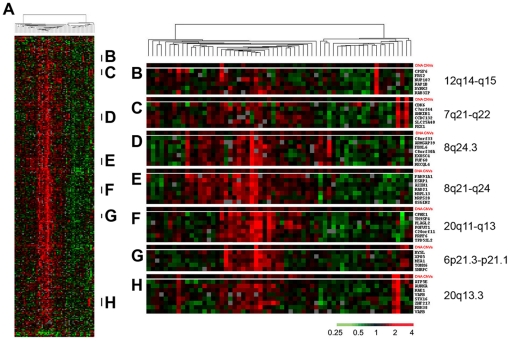
Figure 3. Hierarchical clustering of gastric tumors.
(A) Hierarchical clustering the patterns of variation in expression of 333 candidate oncogene and tumor suppressor genes (from Table S6) in 62 gastric tumors. Each row represented a separate cDNA clone on the microarray and each column represented the expression pattern in a separate tumor or tissue sample. The ratio of abundance of transcripts of each gene to its mean abundance across all tissue samples was depicted according to the color scale shown at the bottom. Gray indicated missing or excluded data. The dendrogram at the top of the figure represented the hierarchical clustering of the tumors based on similarity in their pattern of expression of these genes. (B) to (H) compared DNA copy number changes with the corresponding gene expression values in selected gene clusters in each individual tumor sample. See Table S8 for full data.

