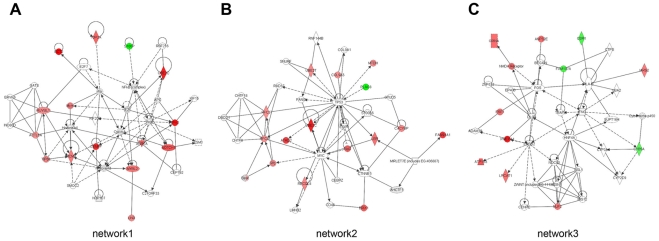
Figure 4. Ingenuity networks in gastric cancer samples.
Ingenuity networks generated by mapping the candidate oncogenes and tumor suppressor genes identified by integrated analysis of expression array and aCGH data. Each network was graphically displayed with genes or gene products as nodes (different shapes represented the functional classes of the gene products) and the biological relationships between the nodes as edges (lines). The length of an edge reflected the evidence in the literature supporting that node-to-node relationship. The intensity of the node color indicated the degree of up- (red) or downregulation (green) of the respective gene. Genes in uncolored notes were not identified as differentially expressed in our experiment and were integrated into the computationally generated networks on the basis of the evidence stored in the IPA knowledge memory indicating a relevance to this network. A solid line without arrow indicated protein-protein interaction. Arrows indicated the direction of action (either with or without binding) of one gene to another.

