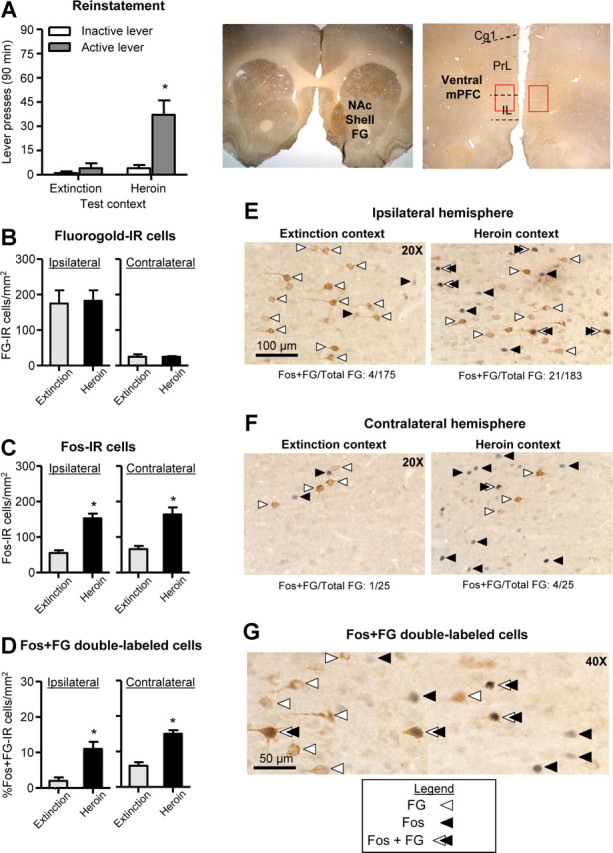
Figure 4.

Unilateral injection of FG into accumbens shell and colocalization of FG with Fos in ventral mPFC after a context-induced reinstatement test. A, Reinstatement Test (left), Total number of active lever and inactive lever presses in rats tested in the Extinction (Control A-B-B) or the Heroin (Renewal A-B-A) context. *p < 0.05, different from the Extinction context, n = 4 per group. FG injection site (right), Representative photomicrograph of unilateral FG injection into accumbens shell (left, 5×) and FG labeling in mPFC (right, 5×). NAc, nucleus accumbens; Cg1, anterior cingulate; Prl, prelimbic; IL, infralimbic. Red squares indicate area of FG and Fos quantification. B, FG-IR cells: Number of FG-IR cells per mm2 in ipsilateral and contralateral ventral mPFC of rats tested in the Extinction or Heroin context. #p < 0.01, different from contralateral, n = 4 per group. C, Fos-IR cells: Number of Fos-IR nuclei per mm2 in ipsilateral and contralateral ventral mPFC of rats tested in the Extinction context or the Heroin context. *p < 0.01, different from the Extinction context. D, Fos +FG double-labeled cells: Percentage of Fos + FG-IR cells in the ipsilateral and contralateral ventral mPFC of rats tested in the Extinction context or Heroin context. *p < 0.01, different from Extinction context. E, F, Representative photomicrographs of Fos and FG cells in ipsilateral (E) and contralateral (F) ventral mPFC of rats tested in the Extinction or Heroin context (20×). G, Representative photomicrograph of ventral mPFC of a rat tested in the Heroin context (40×). White arrows indicate FG-positive cells, black arrows indicate Fos-positive nuclei, and white/black arrows indicate Fos + FG double-labeled cells. Scale bars: (in E), E, F, 100 μm; G, 50 μm.
