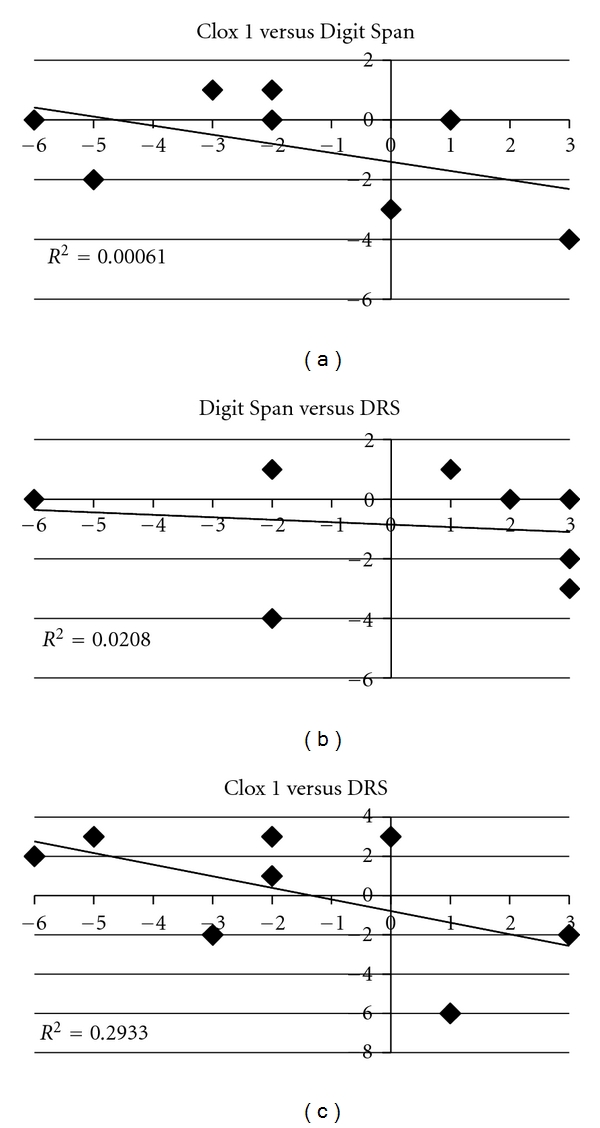
Figure 2.

Comparison of individual performance on Clox 1, the WAIS Digit Span and the DRS Each individual's performance on one test was plotted as a function of the other, and a regression line was determined.

Comparison of individual performance on Clox 1, the WAIS Digit Span and the DRS Each individual's performance on one test was plotted as a function of the other, and a regression line was determined.