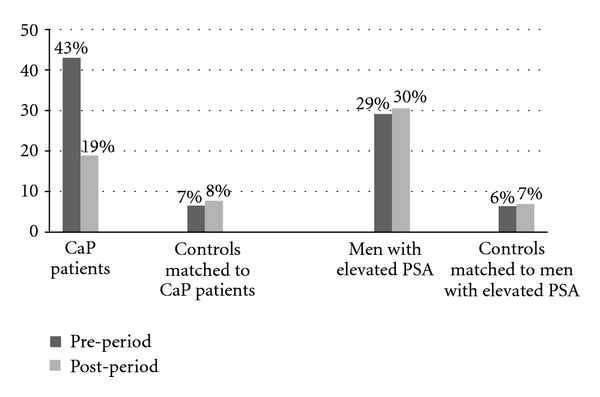
Figure 1.

Prevalence of urinary tract signs and symptoms among CaP patients, men with elevated PSA but no CaP, and matched controls during 12 months prior to and 12 months after the index date in the General Practice Research Database (GPRD, 1998–2008) (Index date was the date of initial CaP diagnosis for prostate cancer (CaP) patients; the date of first elevated PSA test result for men with elevated PSA but no CaP; the same index date as their matched cases for controls). The prevalence odds ratios, OR (95% confidence interval, CI), were 11.3 (9.5–13.6) during 12 months prior to the index date and 2.9 (2.5–3.5) during 12-months post the index date for CaP patients, compared to controls, and were 6.2 (5.6–6.8) during 12 months prior to the index date and 6.1 (5.6–6.7) during 12 months after the index date for men with elevated PSA but no CaP, compared to controls. Among CaP patients, the prevalence OR (95% CI) was 3.2 (2.8–3.6) 12 months prior to versus 12 months after the index date.
