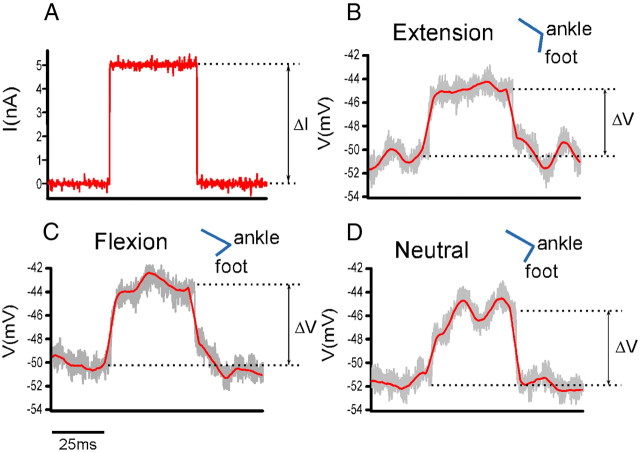
Figure 6.
Conductance measurements. A–D, Small (5 nA) current pulses (A) were passed via intracellular electrode through the homonymous MN soma during ankle rotations at peak extension (B) and peak flexion (C), and while the ankle was held in the neutral position (D). Conductance at each time point was calculated as G = I/ΔV. Overall conductance change during extension (B) was larger than conductance change during flexion (C).

