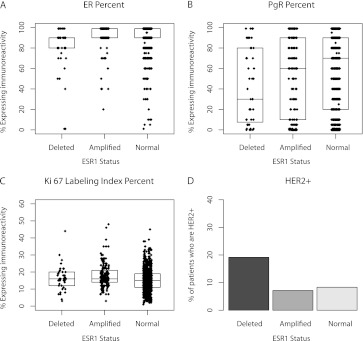
Figure 1.
Box plots illustrating the distribution of ER, PgR and Ki-67 labeling index expression levels according to ESR1 status. Boxes indicate 25th, 50th (median) and 75th percentiles. P values were derived from Wilcoxon rank-sum test for ER percent (P < 0.0001), PgR percent (P = 0.02) and Ki-67 labeling index percent (P < 0.0001) and from Fisher’s exact tests for HER2 (P = 0.04). Missing values were omitted. ER, estrogen receptor; PgR, progesterone receptor; HER2, human epidermal growth factor receptor-2.

