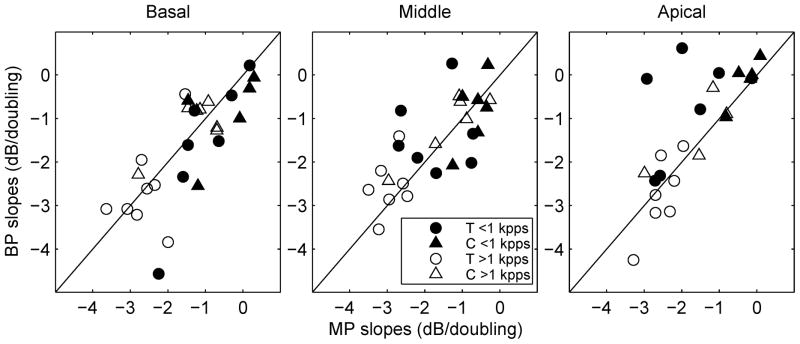
Fig 5.
Scatter plots of slopes of level versus pulse rate functions measured using bipolar versus monopolar stimulation. Circles are used to represent slopes for the T-level functions and triangles are used to represent slopes for the C-level functions. Open symbols are for slopes at > 1000 pps and filled symbols are for slopes at < 1000 pps.

