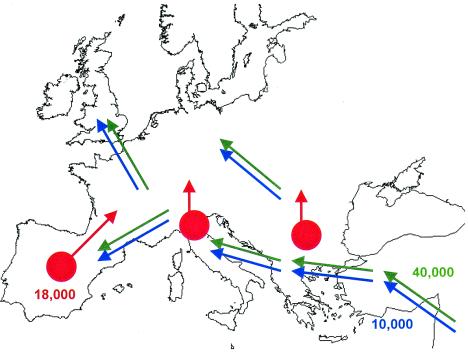
Figure 1.
A scheme of the main demographic processes documented in the archeological record of Europe. Numbers are approximate dates, in years before the present. Green arrows, Paleolithic colonization; red arrows, Mesolithic reexpansions (glacial refugia are represented by red circles); blue arrows, Neolithic demic diffusion.

