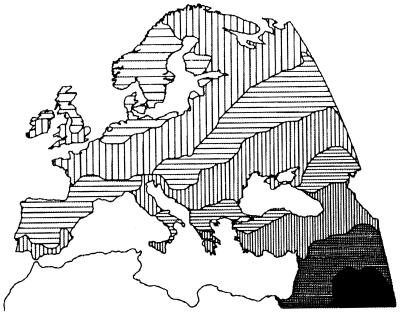
Figure 2.
A summary of genetic variation in Europe: first principal component. Different shades of gray represent different values of a synthetic variable summarizing allele frequencies at 120 protein loci. (Cavalli-Sforza, L. L., et al., The History and Geography of Human Genes. Copyright © 1994 by PUP. Reprinted by permission of Princeton University Press; ref. 20.)

