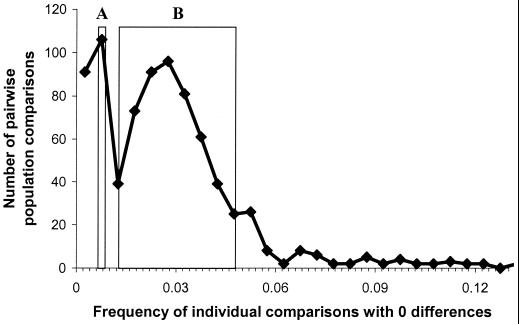
Figure 3.
Observed frequency of identical sequences in 780 pairwise comparisons of 40 European mitochondrial population samples. The two boxes refer to the range of expected values, estimated assuming two rates r of population growth (r = 0.005 and r = 0.008) and a Paleolithic (40,000 years ago; box A) or a Neolithic (4,000 years ago; box B) separation of the gene pools.

