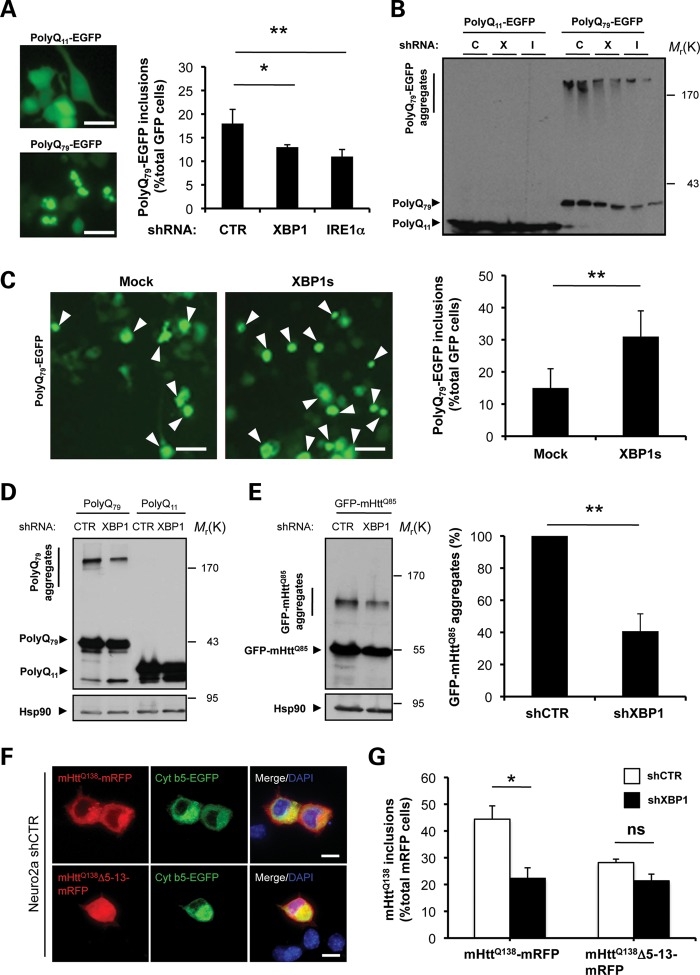
Figure 4.
XBP1/IRE1α deficiency in neuronal cells reduces abnormal mHtt aggregation. (A) NSC34 motoneuron-like cells were stably transduced with lentiviral vectors expressing shRNA against XBP1, IRE1α or control luciferase mRNA (shXBP1, shIRE1α and shCTR, respectively), followed by transient transfection with expression vectors for polyQ79-EGFP and polyQ11-EGFP as control. After 72 h, polyQ79-EGFP intracellular inclusions were quantified by fluorescent microscopy (right panel). Left panel: The number of cells displaying intracellular inclusions was quantified in a total of at least 300 cells per experiment. Results are representative of four independent experiments. Average and standard deviation are presented. Scale bar, 20 μm. (B) In parallel, detergent-insoluble polyQ79-EGFP aggregates were measured in cell extracts prepared in Triton-X100 buffer followed by western blot analysis in 4–12% polyacrylamide gradient gels. shRNA cells: Control (C), XBP1 (X) or IRE1α (I). Results are representative of at least four independent experiments. Two independent experiments per condition are presented. (C) NSC34 cells were co-transfected with an expression vector for XBP1s or empty vector (mock) in the presence of a polyQ79-EGFP expression vector. After 72 h, polyQ79-EGFP intracellular inclusions (right panel) were quantified by fluorescent microscopy (arrowheads). Left panel: The number of cells displaying intracellular inclusions was quantified in at least 300 cells per experiment. Results are representative of four independent experiments. Mean and SEM are presented. Scale bar, 20 μm. (D) Detergent-insoluble polyQ79-EGFP aggregates were measured in cell extracts prepared in Triton X-100 buffer from Neuro2A shXBP1 or shCTR cells. As control, polyQ11-EGFP was expressed in both cell lines. Levels of Hsp90 served as loading control. (E) Neuro2A shXBP1 or shCTR cells were transiently transfected with expression vectors for human mHtt (exon 1) GFP-mHttQ85. After 72 h, GFP-mHttQ85 aggregates were measured in cell extracts prepared in Triton X-100 and analyzed by western blot. Levels of Hsp90 served as loading control. Left panel: mHtt aggregates were quantified and the results are representative of four independent experiments. Mean and SEM are presented. (F) shCTR Neuro2a cells were transiently transfected with mHttQ138-mRFP or mHttQ138Δ5-13-mRFP constructs in the presence of cytochrome b5-EGFP (Cyt b5-EGFP) to label the ER. After 24 h, cells were visualized by confocal microscopy. Nucleus was stained with DAPI. Scale bar, 20 μm. (G) Neuro2A shXBP1 (black bar) or shCTR (white bar) cells were transiently transfected with mHttQ138-mRFP or mHttQ138Δ5-13-mRFP. After 48 h, mHtt intracellular inclusions were quantified in at least 200 cells per experiment. Mean and SEM are presented. *P< 0.05 and **P< 0.01, calculated with Student's t-test.

