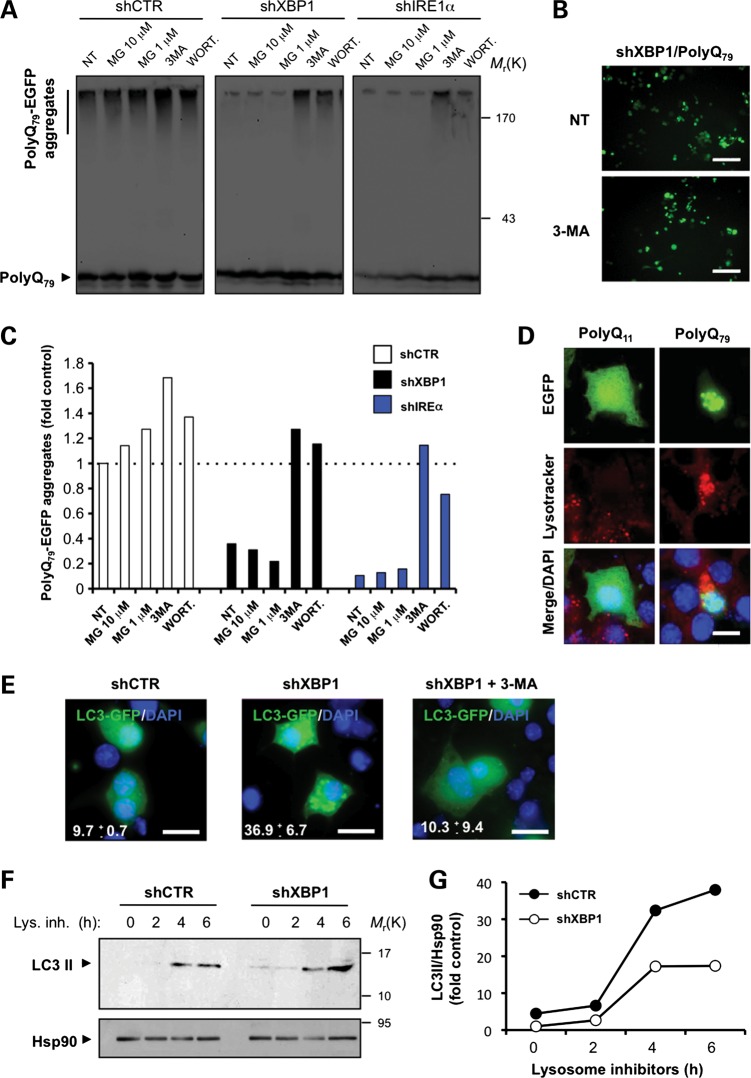
Figure 5.
XBP1 deficiency leads to autophagy-mediated degradation of mHtt in cellular models of HD. (A) NSC34 shXBP1, shIRE1α or shCTR cells were transfected with an expression vector for polyQ79-EGFP, and after 48 h cells were treated with MG132 (10 and 1 μm) for 8 h, or with 10 mm 3-MA or 10 μm wortmannin for 16 h and polyQ79-EGFP aggregation analyzed by western blot in 4–12% polyacrylamide gradient gels. (B) Examples of polyQ79-EGFP intracellular inclusions in shXBP1 cells untreated or treated with 3-MA are presented, visualized by fluorescent microscopy. Scale bar, 50 μm. (C) PolyQ79-EGFP aggregates observed in (A) were quantified in each treatment and for comparison normalized to the value obtained in non-treated shCTR cells. (D) NSC34 cells were transiently transfected with expression vectors for polyQ11-EGFP and polyQ79-EGFP. After 24 h, cells were stained with lysotracker and DAPI, and the co-localization with polyQ79-EGFP intracellular inclusions was determined by confocal microscopy. Scale bar, 10 μm. (E) NSC34 shCTR or shXBP1 cells were transiently transfected with expression vectors for LC3-EGFP and stained with DAPI and visualized by confocal microscopy. After 48 h, cells were treated with 10 mm 3-MA for 16 h. Scale bar, 20 μm. (F) To monitor LC3 flux through the autophagy pathway in Neuro2A shCTR or shXBP1, cells were treated or not with a lysosome inhibitor cocktail (lys. inh.) containing 200 nm bafilomycin A1, 10 μg/ml pepstatin and 10 μg/ml E64d for indicated time points and endogenous LC3 levels monitored by western blot. Hsp90 levels served as loading control. (G) Kinetics of the accumulation of LC3-II protein showed in (F) was quantified and normalized to Hsp90 levels and then to non-treated shCTR cells.

