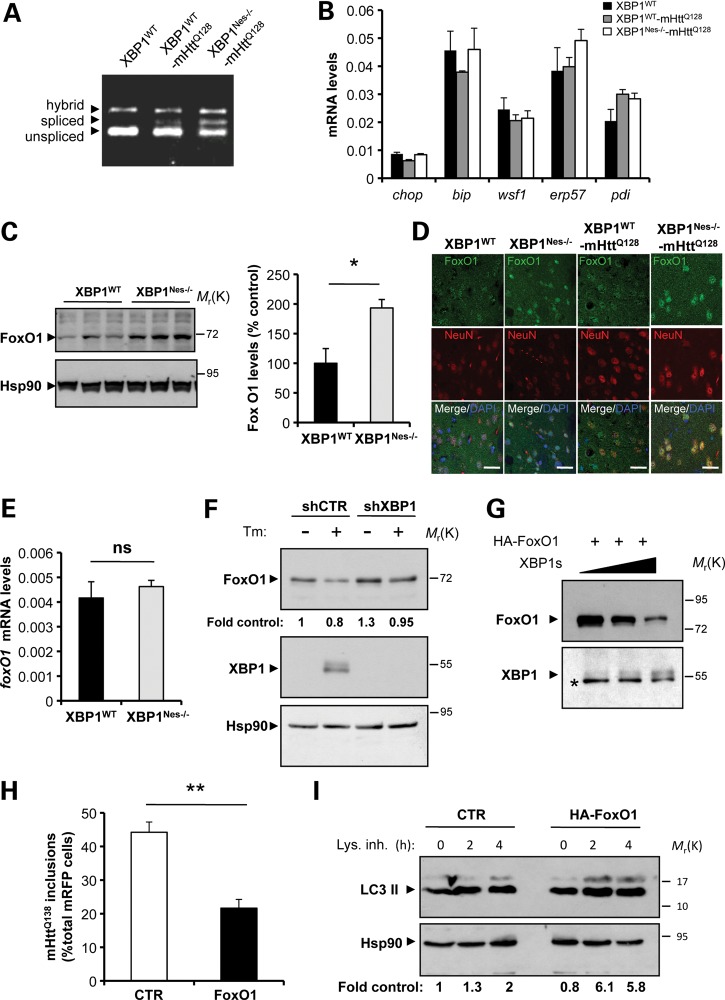
Figure 7.
XBP1 negatively regulates FoxO1 expression. (A) The levels of XBP1 mRNA splicing were analyzed in the striatum from XBP1Nes−/−-mHttQ128 and littermate control mice at 3 months of age. (B) The mRNA levels of indicated UPR-target genes were measured by real-time PCR in total cDNA obtained from the striatum of four XBP1Nes−/−-mHttQ128 mice or littermate control mice at 6 months of age. All samples were normalized to β-actin levels. Average and SEM of the analysis of three animals per group are shown. (C) FoxO1 levels were analyzed in the striatum of 6-month-old mice by western blot. Hsp90 was used as loading control. Left panel: The relative levels of FoxO1 were quantified from XBP1WT (n= 3) and XBP1Nes−/− (n= 3) mice and normalized with Hsp90 levels. Mean and SEM are presented. (D) The distribution of FoxO1 (green) was analyzed in the striatum of XBP1WT−-mHttQ128, XBP1Nes−/−-mHttQ128, XBP1WT and XBP1Nes−/− animals at 6 months of age. Co-staining with NeuN (red) and DAPI (blue) stain nucleus was performed. Images were visualized with a confocal microscope and represent the analysis of three animals per group. Scale bar, 50 μm. (E) The mRNA level of foxO1 was analyzed by real-time PCR in total cDNA obtained from the brain striatum of XBP1Nes−/− or littermate control mice. All samples were normalized to β-actin levels. Average and SEM of the analysis of three animals per group are shown. (F) Neuro2A cells were stably transduced with lentiviral vectors expressing shRNA against XBP1 or control luciferase mRNA (shXBP1 and shCTR, respectively). FoxO1 and XBP1s levels were monitored after treatment with Tm (5 μg/ml, Tm) for 8 h, using western blot analysis. Levels of Hsp90 were used as loading control. Quantification is presented at the bottom of the gel as fold change. (G) HEK cells were transiently transfected with expression vectors for HA-FoxO1 and different concentrations of XBP1s or empty vector (pCDNA.3). FoxO1 and XBP1s levels were analyzed by western blot. The asterisk indicates unspecific band used as loading control. (H) Neuro2A cells were co-transfect with expression vector for mHttQ138-mRFP with HA-FoxO1 or empty vector, and after 48 h, the number of RFP-positive cells containing mHtt inclusions was quantified. Mean and SEM are presented. **P< 0.01, calculated with Student's t-test. (I) Neuro2A cells were transiently transfected with an HA-FoxO1 expression vector or empty vector, and then treated for the indicated times with a cocktail of lysosomal inhibitors (200 nm bafilomycin A1, 10 μg/ml pepstatin and 10 μg/ml E64d). LC3-II flux was then monitored by western blot analysis and normalized with the loading control and as a fold change to the untreated control cells (quantification at the bottom).

