Figure 4.
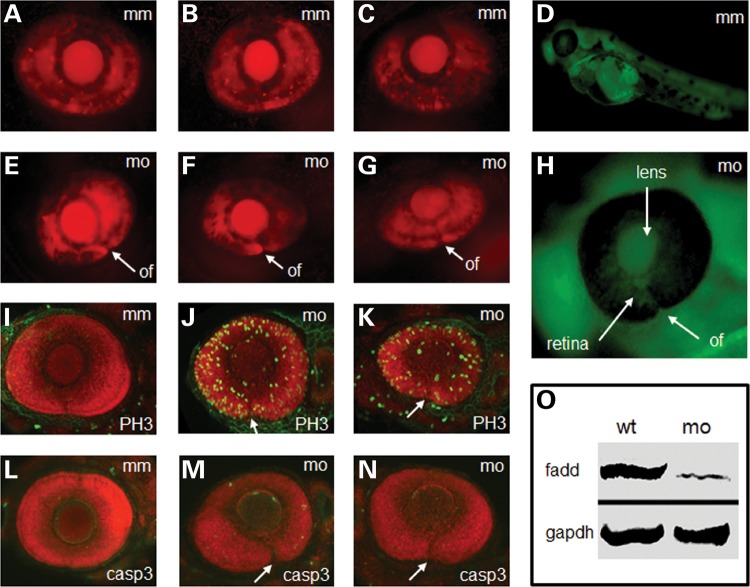
Fadd knockdown and analysis of zebrafish morphants at 72 hpf. (A–C) Representative images of control fadd mismatch morpholino (mm) injection on eye development. (D) Distribution of fadd morpholino detected by 3′-carboxyfluorescein modification of antisense morpholino. (E–G) Representative images of fadd antisense morpholino (mo) injection on eye development. (H) Magnified image of the eye showing distribution of the fadd antisense morpholino in the lens and retina. (I–K) Phosphohistone-H3 (PH3) labelling (green) in fadd mm and fadd mo knockdown eyes. (L–N) Activated caspase-3 (casp3) labelling (green) in fadd mm and fadd mo knockdown eyes. (O) Western blot from fadd mm and fadd mo embryos. GAPDH used as loading control. (A–C and E–G) Red fluorescence derived from ath5-Gal4 x UAS-NR:mcherry transgene driving reporter expression in the developing eye. (I–N) embryos counterstained with Bodipy Texas-Red. All embryo images represent a projection through a confocal stack. (E–N) optic fissure (of) is indicated by a white arrow.

