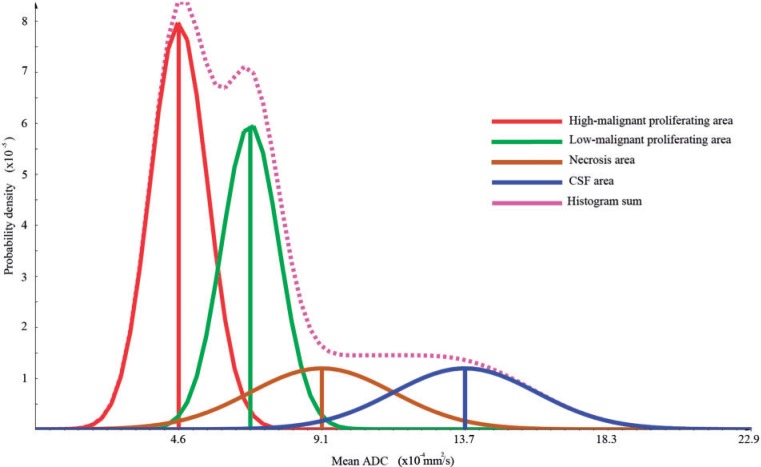
Figure 1.
Theoretical histogram: red depicts the high-proliferating area, green the low-proliferating region, brown the necrosis area and blue the CSF. The volume fractions of the different compartments were set to 0.4:0.3:0.15:0.15 for high-proliferating, low-proliferating, necrosis, and CSF, respectively.

