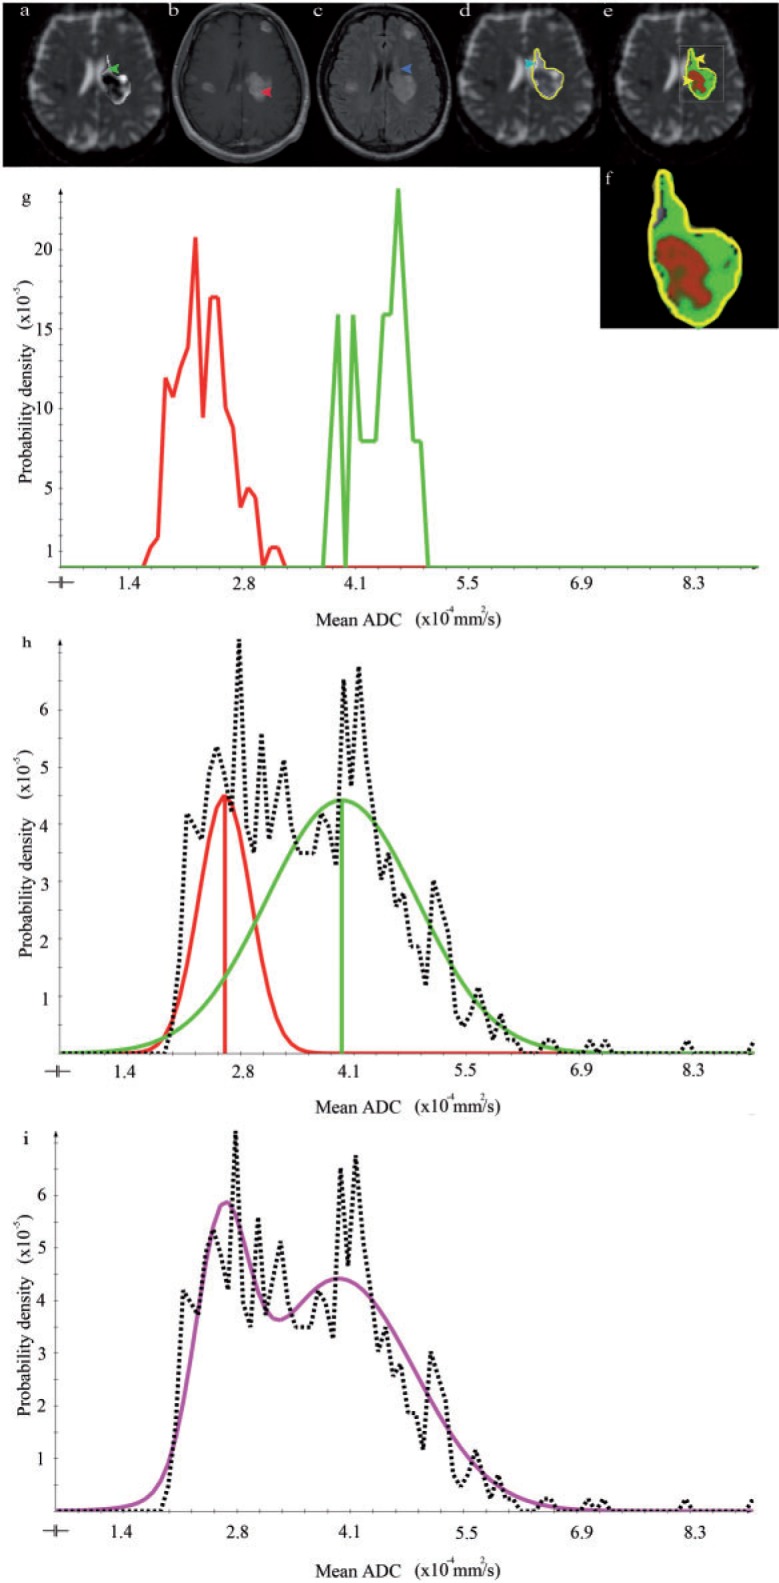
Figure 4.

Imaging data, histogram analysis, and resulting segmentation of patient 1 (WH) (a) Axial ADC map. The arrow points to a low-proliferative area of the tumor. (b) Axial contrast-enhanced T1-weighted image. The arrow indicates a high-proliferating part of the tumor. (c) Axial T2-weighted FLAIR image. The arrow points to a low-proliferative area of the tumor. (d) ADC map with GTV outlined in yellow. The arrow indicates CSF. (e) Segmentation result shows the posterior probability of high- (red) and low-proliferative (green) areas. (f) Enlarged outline of the posterior probability as shown in (e). (g) ADC histogram within the manually drawn ROIs. High- and low-proliferating distributions are represented in red and green, respectively. (h, i) ADC distribution within the GTV. The dotted line shows the ADC distribution after necrosis and CSF exclusion. The fitted Gaussian distributions for the high- and low-proliferating tissue classes are depicted in red and green, respectively. The sum of these distributions represents the data appropriately (see purple line).
