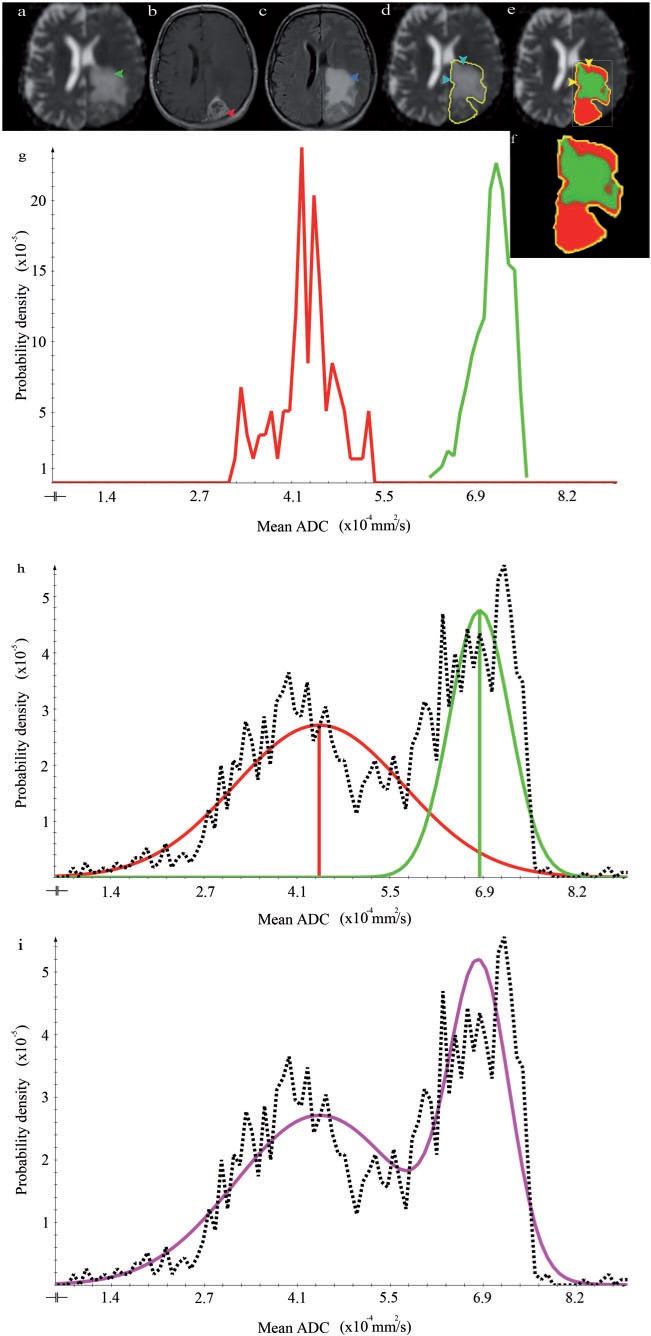
Figure 6.
The results for patient 3 (SHE) organized as in Fig. 4. The GTV outline in this patient includes normal brain tissue (d, arrows). This leads to a misclassification of normal brain tissue as a high-proliferative area (e, arrows). The sum of the Gaussian distributions represents the data appropriately (h, purple line).

