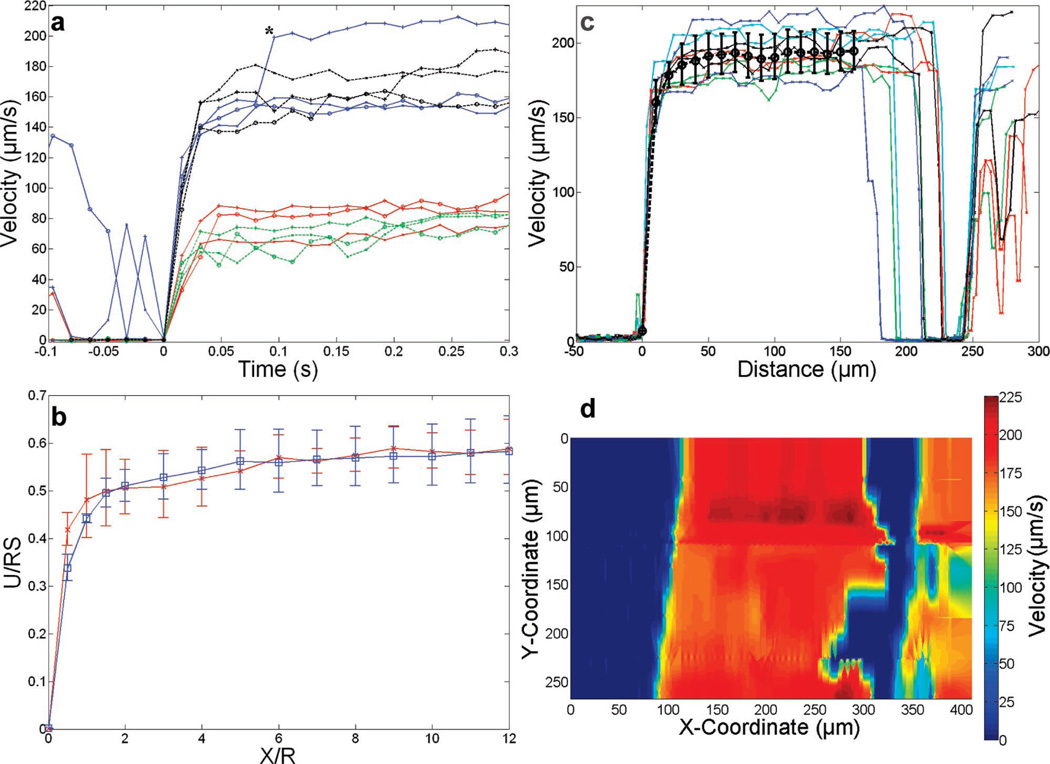
Figure 3.
Investigation of microbead acceleration in the gap region lacking PSGL-1. (a) Microbead x-velocity as a function of time after detachment. Microbeads with a diameter of 6 µm were observed to detach from an accumulation strip at a wall shear rate of 50 (red tracings) and 100 s−1 (blue tracings). Microbeads detaching from an edge created by adsorption from a droplet at a wall shear rate of 50 (green dashed tracing) and 100 s−1 (black dashed tracing) behaved similarly to microbeads passing over the patterned gap, suggesting there were no PDMS particles left on the surface. *A rapid increase in velocity of the blue tracing indicated by plus symbols at 0.08 s after detachment occurred as an out-of-focus bead passed over the tracked bead. (b) Plots of the nondimensional geometric average velocity (left axis: velocity normalized by the microbead radius and wall shear rate) as a function of the nondimensional distance (bottom axis: distance normalized by the microparticle radius) from the detachment point at 50 (red) and 100 s−1 (blue). Error bars indicate the geometric standard deviation. (c) Tracking results for 10 of the 10-µm beads used to create the functional map in (d) at a wall shear rate of 67 s−1. The mean is shown in heavy black circles. (d) Heat map generated by spatial interpolation of microbead velocities.

