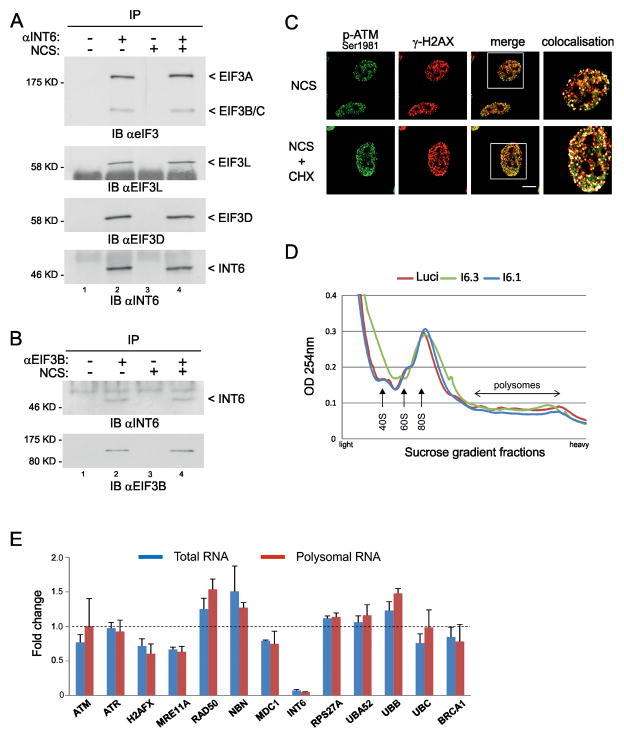
Figure 6.
INT6 activity in DDR does not rely on a translational effect. (A) HeLa cells were treated, or not, with NCS (200 ng/ml, 30 min) and whole cell extracts were prepared 1 h later. Lysates were immunoprecipitated with preimmune serum (lanes 1, 3) or an antibody to INT6 (lanes 2, 4). Co-immunoprecipitated proteins were analyzed by immunoblotting using antibodies against total eIF3 (only the part of the blot corresponding to the largest eIF3 subunits is shown) or against EIF3L and EIF3D. Recovery of INT6 is shown on bottom panel. (B) Cytoplasmic extracts were prepared from HeLa cells treated as in (A) and were immunoprecipitated with a control antibody (lanes 1, 3) or an antibody to EIF3B (lanes 2, 4). Co-immunoprecipitated proteins were immunoblotted with an antibody to INT6. The same membrane was reprobed with an antibody against EIF3B to verify its pull-down. (C) Hela cells were treated with NCS (200 ng/ml, 15 min) in the presence or absence of 50 μg/ml cycloheximide (CHX). After washing out of NCS, CHX was maintained for 2 h and cells were immunostained using antibodies to Ser1981-phosphorylated ATM and γ-H2AX. Representative confocal images are shown. Scale bar, 10 μM. White squares on merge images delineate regions shown in right panels. These are composite images obtained using the Co-localization Highlighter plug-in for ImageJ. Co-localized pixels appear as white dots. (D) UV-absorbance profiles of cytoplasmic extracts from HeLa cells through a 10–50% sucrose gradient. Cells were transfected with siRNAs control or targeting INT6 for 70 h, treated with NCS (200 ng/ml, 1 h), and collected after 1 h. Positions of 40S and 60S ribosomal subunits, 80S monosomes and polysomes are shown. (E) Transcripts encoding DDR proteins were measured using the NanoString nCounter system from total and polysomal RNAs isolated from cells transfected as in (D). Results are expressed as the mean fold-change of three independent experiments (INT6 knock-down versus control) and error bars correspond to standard deviation. Detailed results and procedures are in Tables S1, S2 and Supplemental Methods.

