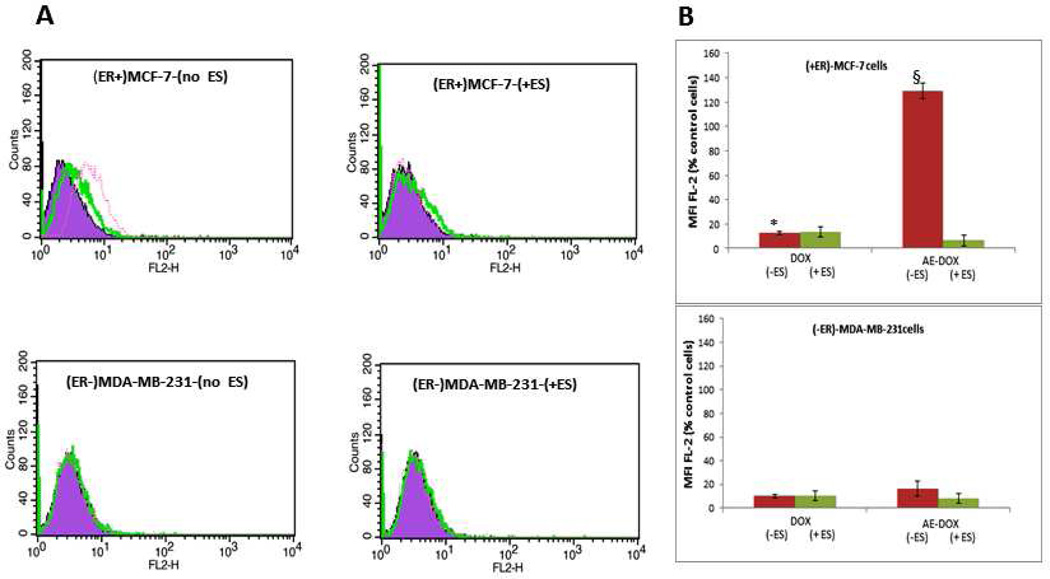
Figure 7.
The FACS analysis of ER(+)MCF-7 and ER(−)MDA-MB-231 cells. A) Histogram analysis of cells treated with 0.1 µM of Dox and AE-Dox 15 with and without ES; (purple) cells only (green) Dox treated cells and (red) AE-Dox treated cells. B) The percentage of Dox- positive cells in ER (+)MCF-7 and ER (−)MDAMB-231 cells; *P<0.01 (Dox vs AE-DOX (−ES)); §P<0.01 (AE-Dox (−ES) vs AE-Dox(+ES);

