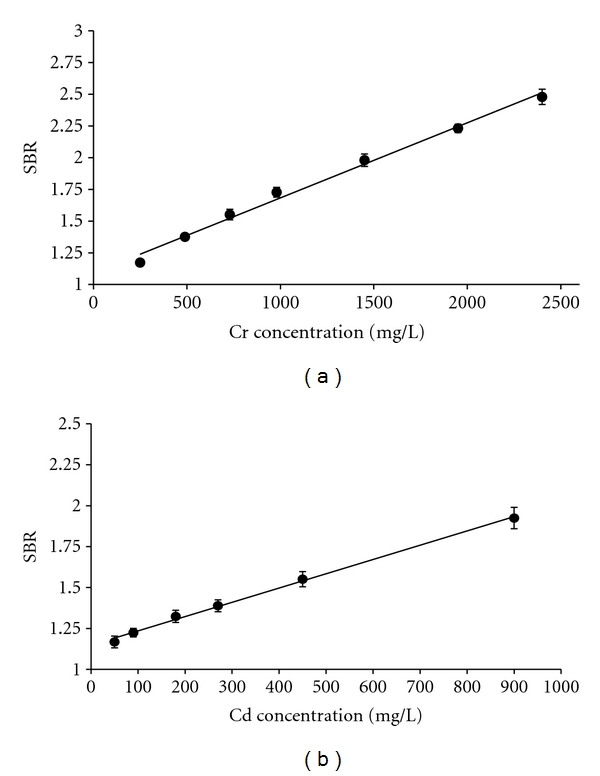
Figure 6.

Calibration curve; concentration versus signal intensity (SBR) for Cr (427.481 nm) and Cd (226.502 nm). Error bars denote the 95% CI and are based on replicate (10) measurements.

Calibration curve; concentration versus signal intensity (SBR) for Cr (427.481 nm) and Cd (226.502 nm). Error bars denote the 95% CI and are based on replicate (10) measurements.