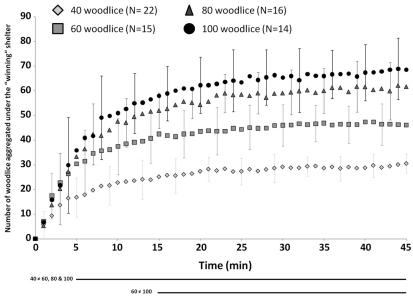
Figure 4.
Dynamics of aggregation under the “winning” shelter. Evolution of the average number of woodlice under the winning shelter as a function of time for the four densities tested and for experiments showing a clear choice of one of both shelters. Standard deviations are presented for each 4 minutes. Horizontal lines below the graph indicated the statistical differences between densities; these differences were pointed out by a Kruskal-Wallis followed by a Dunn’s tests for each minute of the experiments.

