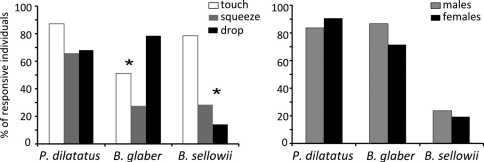
Figure 3.
A Percentage of responsive individuals to each specific stimulus, in relation to the total number of responsive individuals of each species. B Percentage of responsive males and females in relation to the total number of males and females of each species tested. The * indicates a significant difference between stimuli, after a χ2 test.

