. 2011 May 26;2011:128318. doi: 10.4061/2011/128318

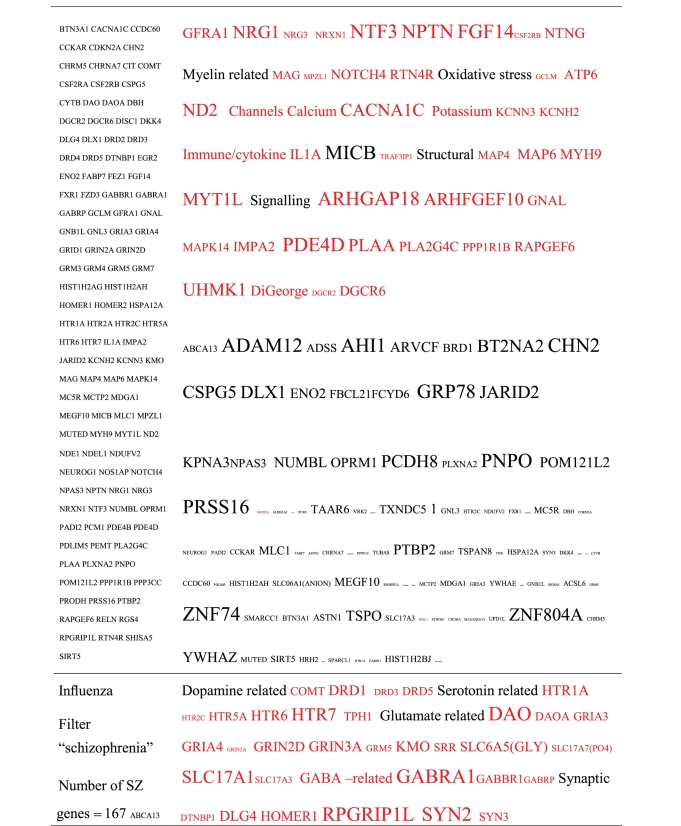
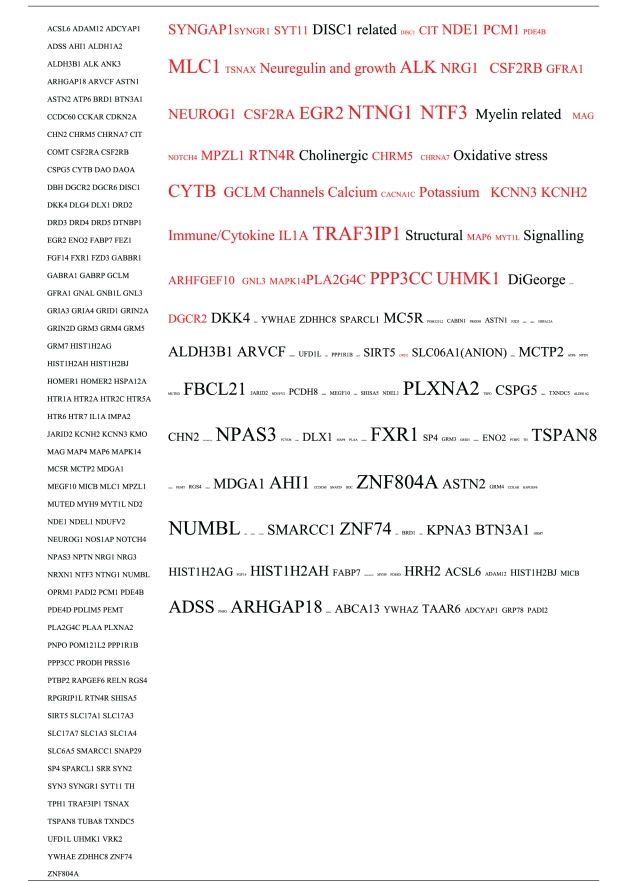
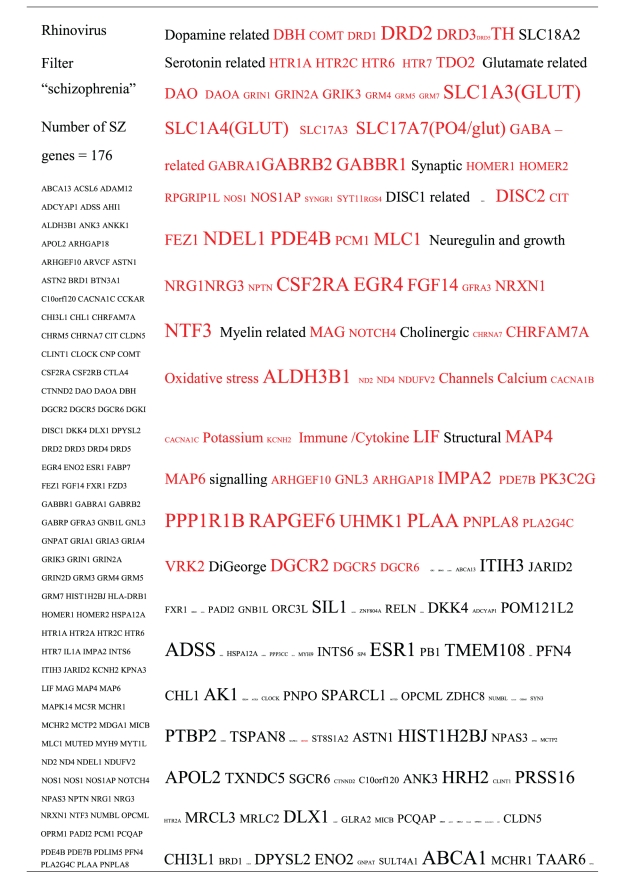
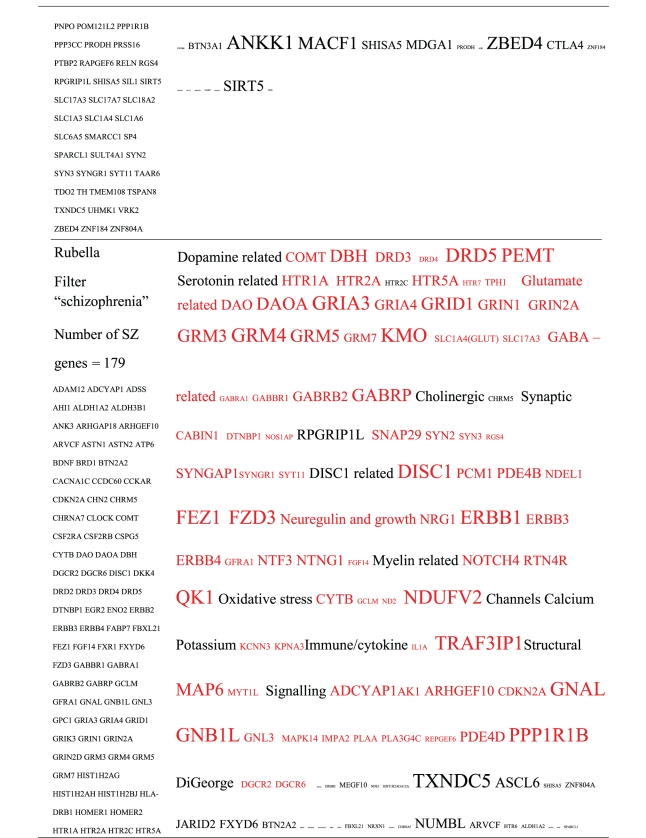
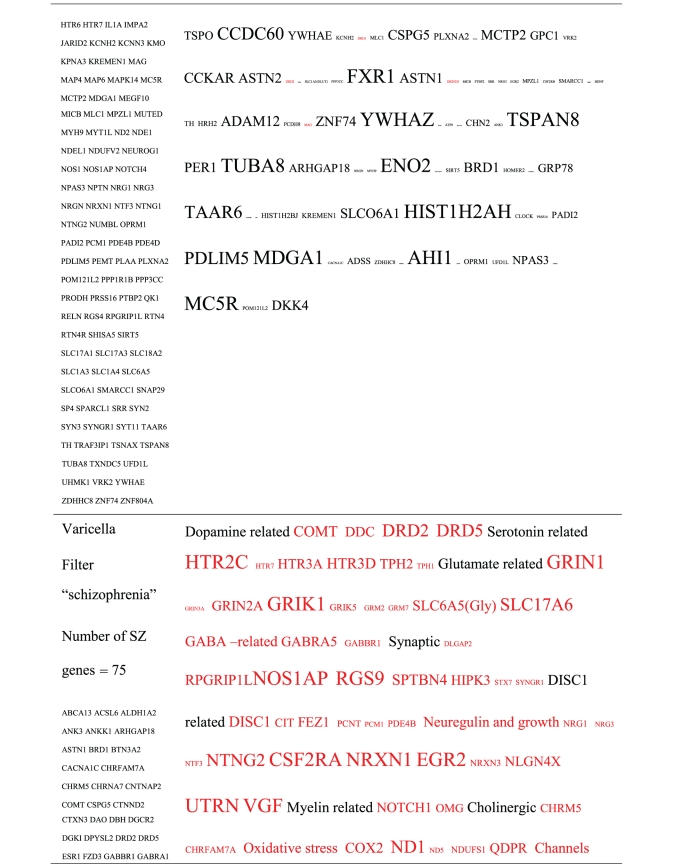
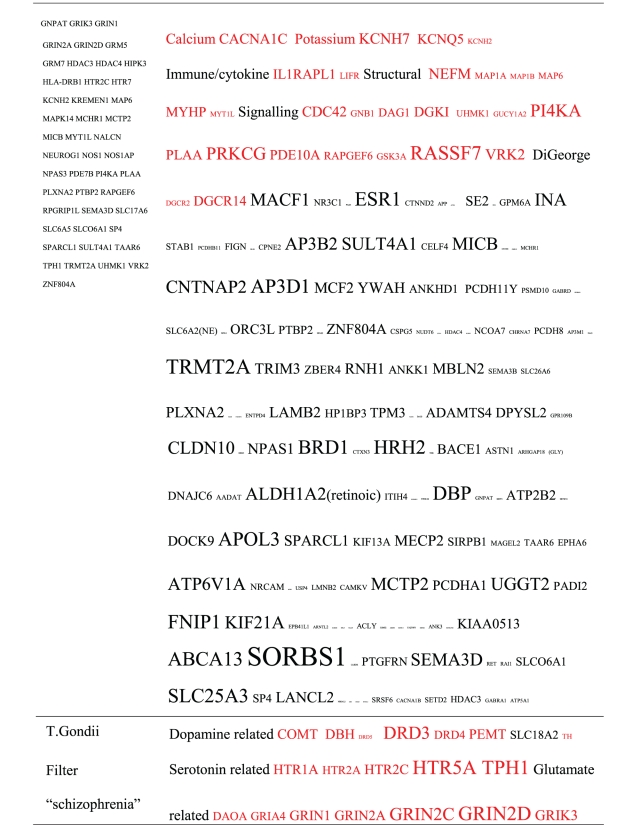
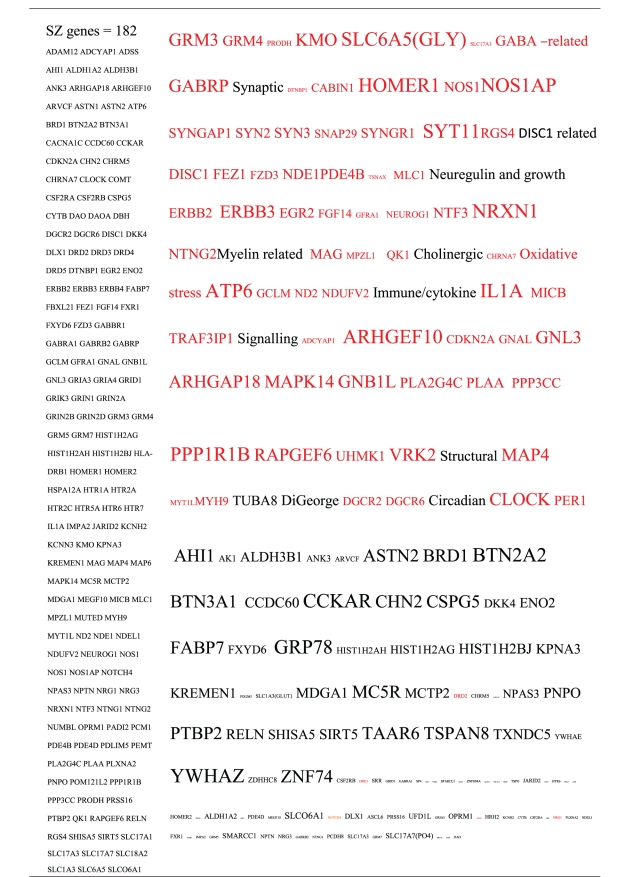
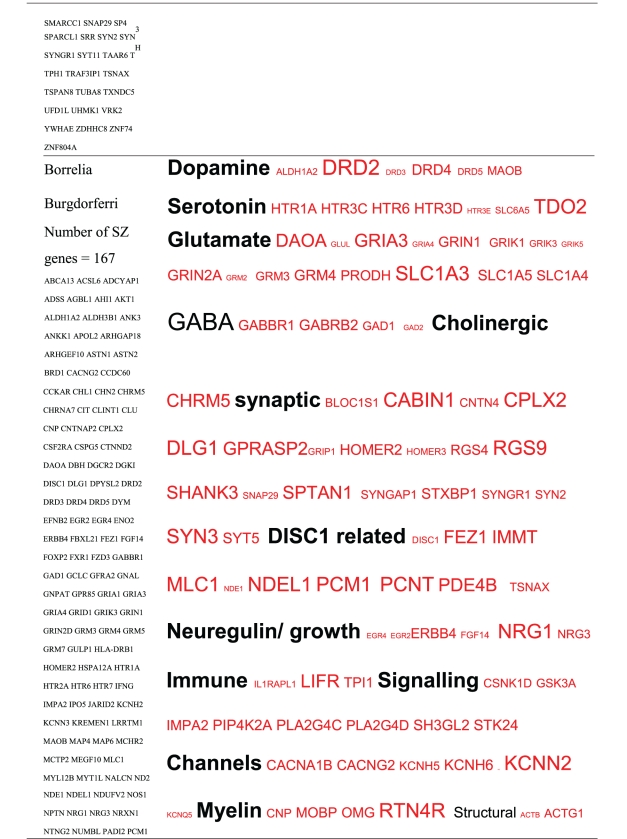
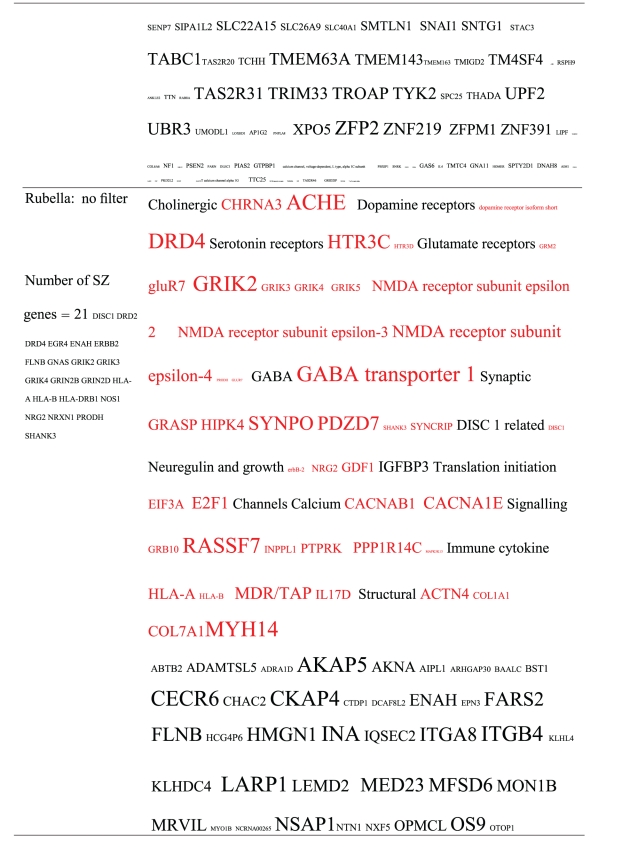
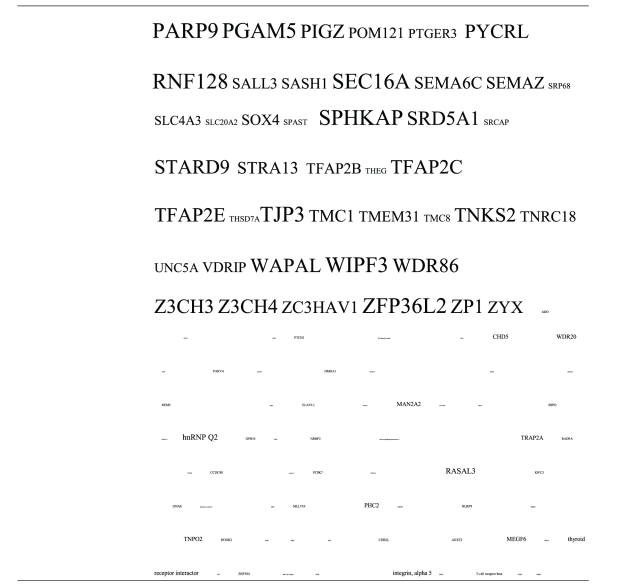
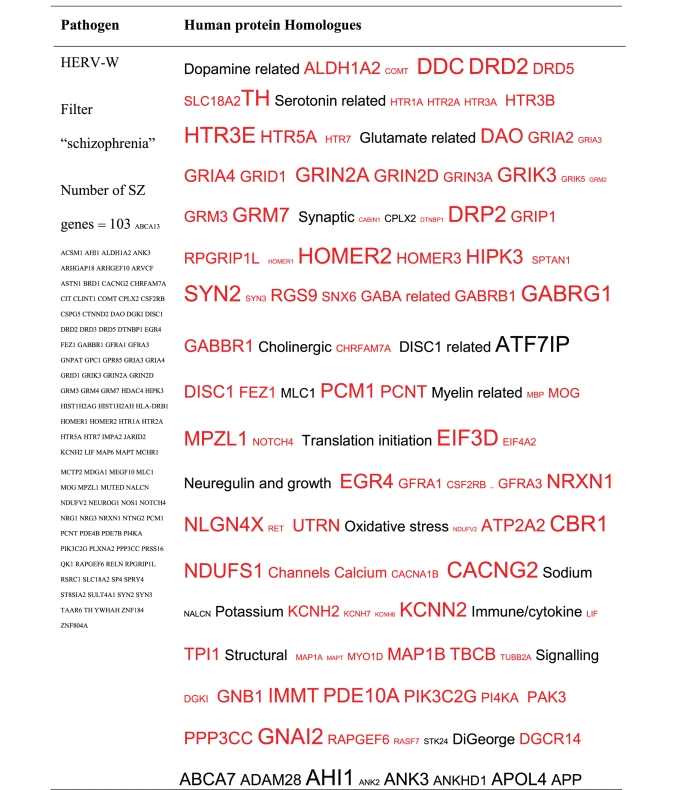
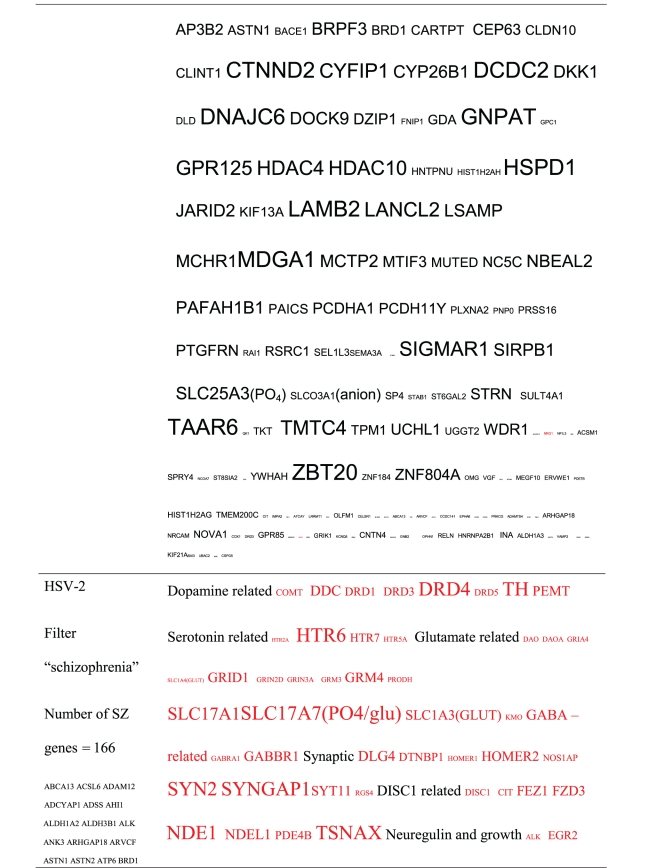
Table 3.

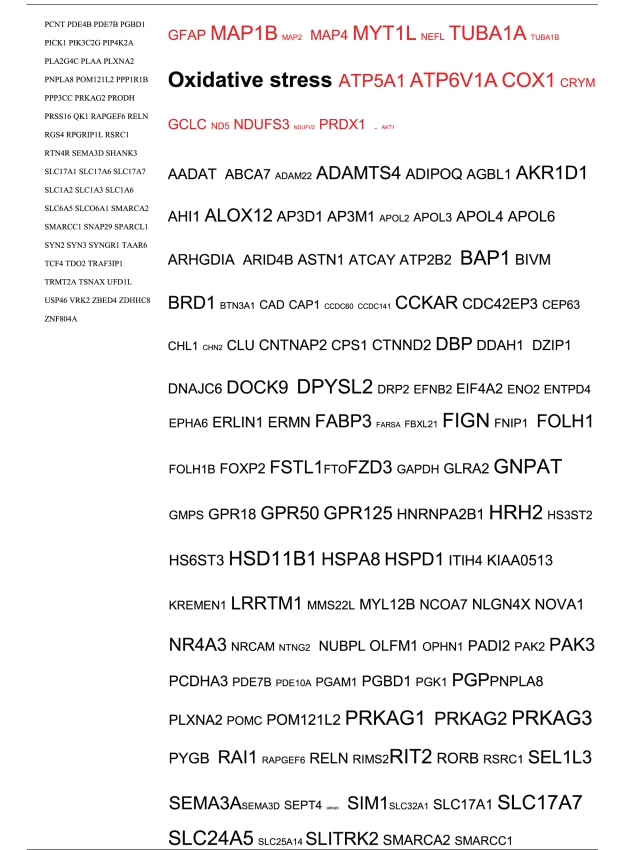
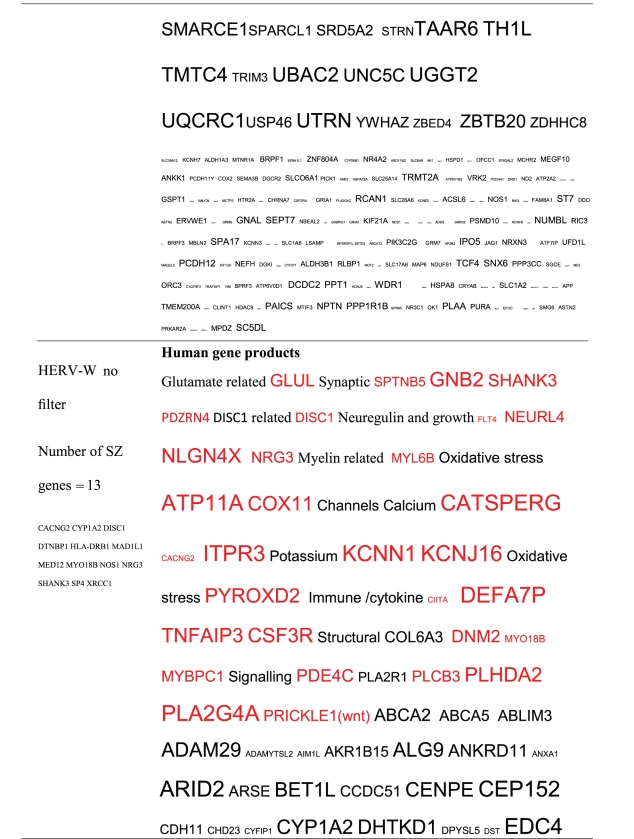
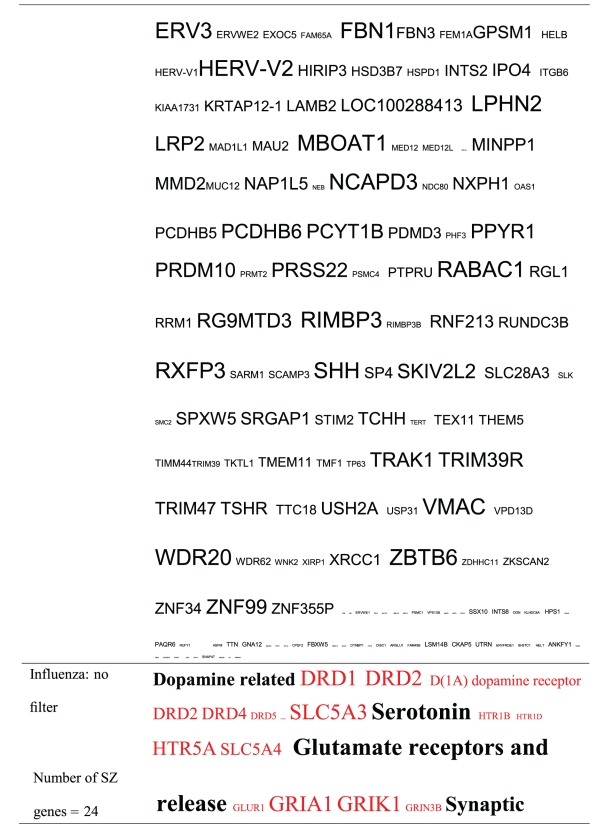
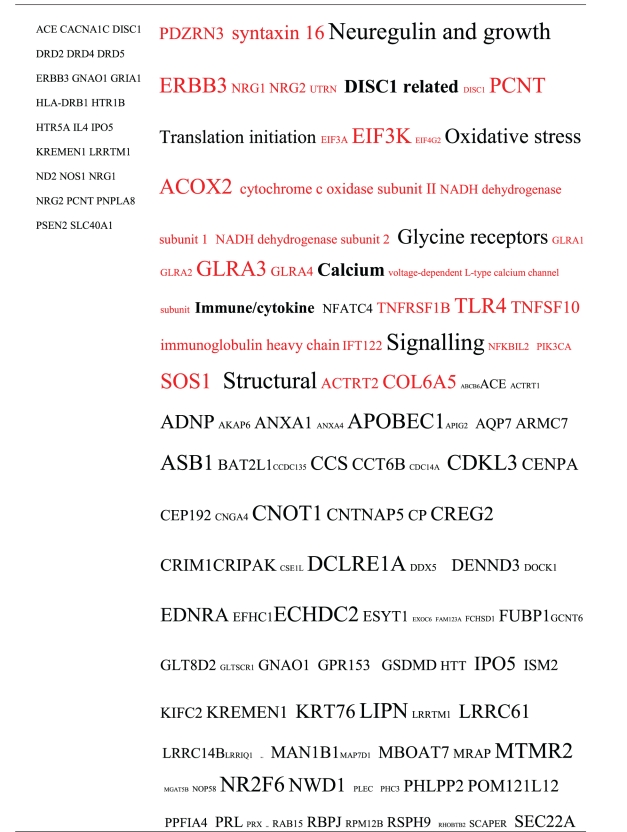
Human proteins with homology to proteins expressed by pathogens. The size of the tags reflects the number of pathogen's proteins that are homologous to the human protein: the filters used are described. The number of schizophrenia susceptibility genes within each of these datasets is shown in the left-hand column. Certain genes are classified according to family and are highlighted in red. Gene definitions and the original BLAST files can be found at http://www.polygenicpathways.co.uk/blasts.htm. Note that the homologues are often clustered in families (e.g., HTR1A, HTR2A, HTR3A, HTR3B, HTR3E, HTR5A, and HTR7).
graphic file with name JPATH2011-128318.tab.002a.jpg graphic file with name JPATH2011-128318.tab.002b.jpg graphic file with name JPATH2011-128318.tab.002c.jpg graphic file with name JPATH2011-128318.tab.002d.jpg graphic file with name JPATH2011-128318.tab.002e.jpg graphic file with name JPATH2011-128318.tab.002f.jpg graphic file with name JPATH2011-128318.tab.002g.jpg graphic file with name JPATH2011-128318.tab.002h.jpg graphic file with name JPATH2011-128318.tab.002i.jpg graphic file with name JPATH2011-128318.tab.002j.jpg graphic file with name JPATH2011-128318.tab.002k.jpg graphic file with name JPATH2011-128318.tab.002l.jpg graphic file with name JPATH2011-128318.tab.002m.jpg graphic file with name JPATH2011-128318.tab.002n.jpg graphic file with name JPATH2011-128318.tab.002o.jpg graphic file with name JPATH2011-128318.tab.002p.jpg