Figure 3.

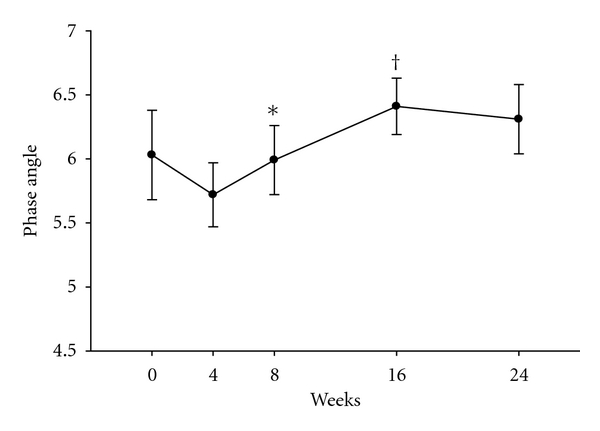
Phase angle during treatment. Average phase angle (shown on Y axis) by bioelectrical impedance analysis at each study week. *P = 0.005 compared to week 4. Whiskers represent standard errors. † P = 0.01 compared to week 8.

Phase angle during treatment. Average phase angle (shown on Y axis) by bioelectrical impedance analysis at each study week. *P = 0.005 compared to week 4. Whiskers represent standard errors. † P = 0.01 compared to week 8.