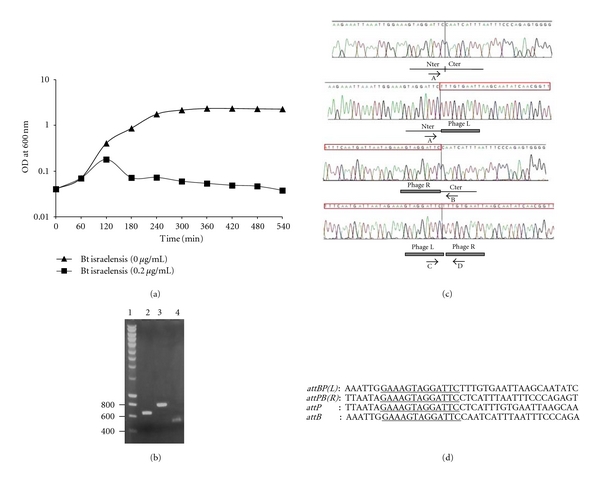
Figure 2.

phIS3501 induction. (a) Effect of mitomycin C treatment on growth of B. thuringiensis var israelensis ATCC35646. Optical densities are shown of cultures treated (squares) or untreated (triangles) by mitomycin C (0.2 μg/mL) added at time point of 60 min. (b) Detection of replicative form of phIS3501 DNA. PCR reactions were done using the total DNA extracted from the cell pellet (lanes 2 and 3) or supernatant (lane 4) 20 min after mitomycin C addition. Primers used: lane 2, PHISI2 × PHISI3 (specific to phage DNA); lane 3, PHIST6 × PHIST7 (specific to host chromosomal DNA); lane 4, PHISK6 × PHISS8 (specific to replicative or mature form of phage DNA). A few molecular weight marker sizes (lane 1) are indicated in bp to the left of gel. Obtained product sizes correspond to the ones expected from the sequence. (c) Sequencing tracks corresponding to integrated and excised DNA of phIS3501 and of the host. DNA for PCR amplification was extracted from noninduced overnight culture of B. thuringiensis var israelensis ATCC35646. Cartoons under the sequencing tracks show their interpretation in relevance to the phage integration status. Nter and Cter are the chromosomal parts of the hlyII gene. Phage L and Phage R are the ends of integrated phIS3501. The phage sequences are shown inside of red bar above the sequencing tracks. PCR amplification and (sequencing) primers were, from top to the bottom: PHISC7 × PHISE8 (PHISA2); PHISA2 × PHISC8 (PHISA2); PHISK5 × PHISC5 (PHISC5); PHISK6 × PHISS8 (PHISK6). (d) The bacterial and phage attachment sites. The derived phage (attP) and bacterial (attB) attachment sites based on the data presented in (c). Thirteen bases common sequence, presumably recognized by the phage integrase, is underlined.
