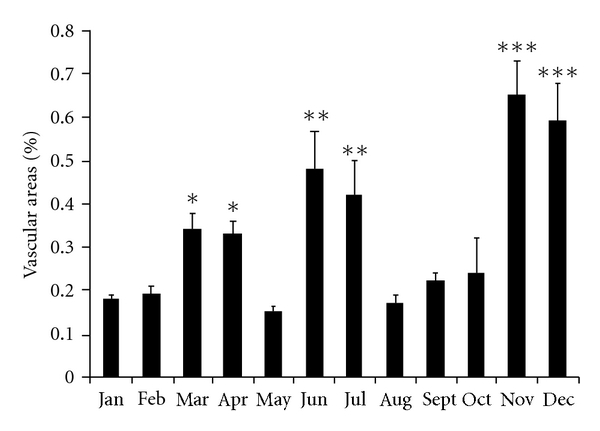
Figure 11.

Vascular areas in testes throughout the year. A significant increase was observed in three different times of the year. A higher increase was observed in November and December when compared to the other months (***P < 0.001). Different symbols show significant differences: (**P < 0.01; *P < 0.05).
