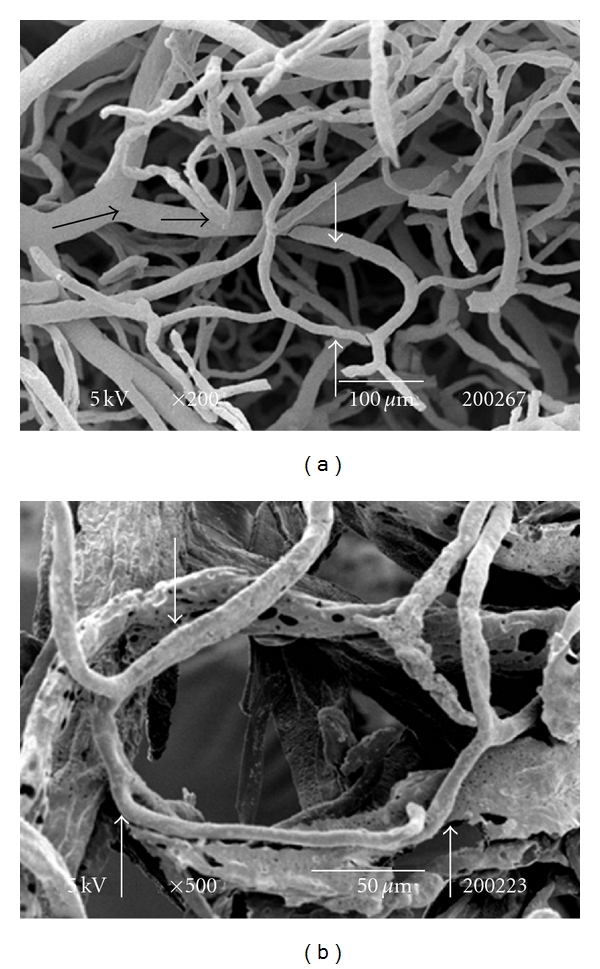
Figure 3.

(a) SEM: dichotomic branches from different pre-capillary arterioles (black arrow) show peritubular patterns determined by the layout of the seminiferous tubules (white arrow). Bar = 100 μm. (b) SEM: Idem. Peritubular vascularisation (arrows). Bar = 50 μm.
