Figure 8.

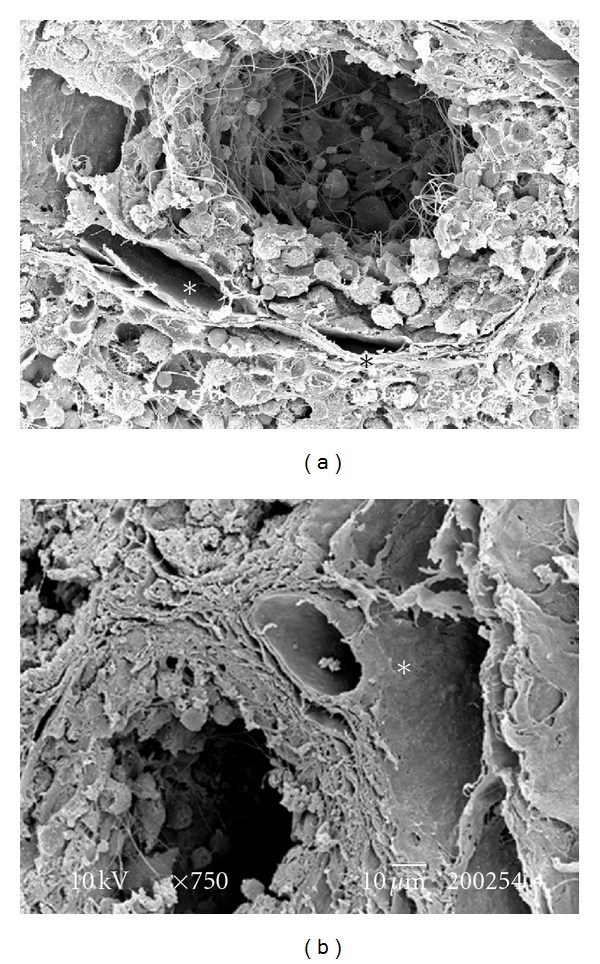
(a, b) SEM over intact tissue: seminiferous tubules showing different stages of maturation. Vessels (*) can be seen surrounding these tubules. Bar = 10 μm.

(a, b) SEM over intact tissue: seminiferous tubules showing different stages of maturation. Vessels (*) can be seen surrounding these tubules. Bar = 10 μm.