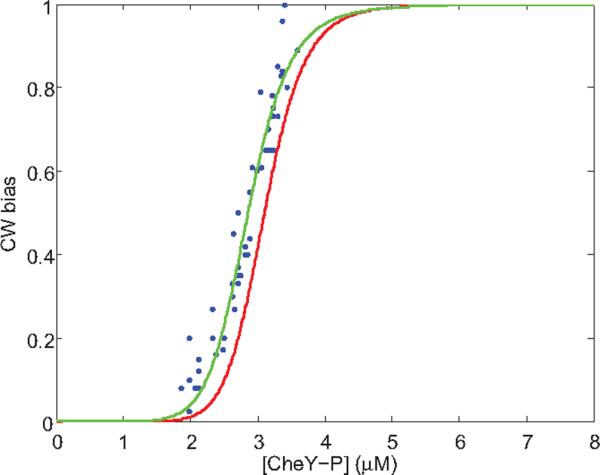
Fig. 3.

CW bias as a function of CheY-P concentration. The red curve is for pre-stimulus wild-type motors, as measured by Cluzel et al.6 and fit with an MWC model with 34 FliM units26. The blue dots are data for motors that have partially adapted to stepwise addition of attractant, with a two-parameter fit to the MWC model with Nav = 36 FliM units shown by the green curve; see text.
