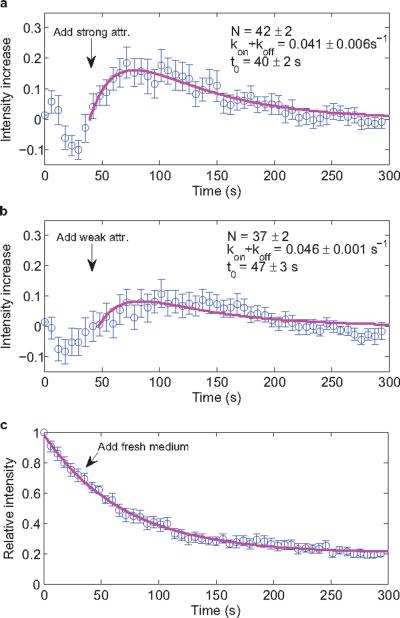
Fig. 4.
Changes in single-motor FliM-YFP fluorescence intensities in cheR cheB cells tethered by hooks and stimulated by addition of attractant (at time t0, arrow). The intensity for a given motor was normalized by its intensity at time 0, intensities for different motors were averaged, and the fit to the control of panel c was subtracted. Fits with the model are shown in magenta and the parameters for these fits are given. Error bars are standard errors of the mean. (a) Responses of 20 motors to addition of 2 mM MeAsp + 0.5 mM L-serine. (b) Responses of 22 motors to addition of 1 mM MeAsp. (c) Responses of 15 motors without addition of attractant, fit with an exponential decay function plus a constant.

