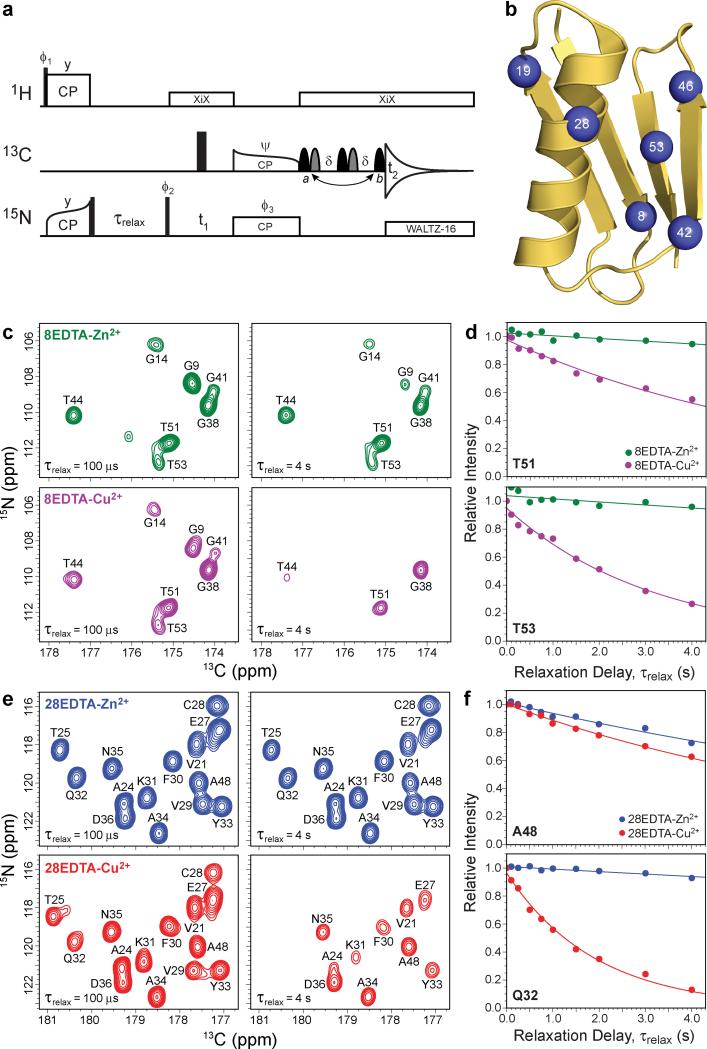
Figure 1. Determination of longitudinal backbone amide 15N paramagnetic relaxation enhancements in Cys-EDTA-Cu2+ GB1 mutants by solid-state NMR spectroscopy.
a, Pulse scheme used to determine residue-specific longitudinal 15N rate constants, R1, from a series of 2D 15N-13CO correlation spectra recorded with different values of the relaxation delay, τrelax. See Supplementary Fig. S1 for the complete pulse scheme description. b, Ribbon diagram of GB1 (PDB entry 2GI9) with the locations of the non-native Cys-EDTA-Cu2+/Zn2+ tags in point mutants investigated in this study (residues 8, 19, 28, 42, 46 or 53) indicated by blue spheres. c, Small regions of 2D 15N-13CO spectra recorded for 13C,15N-labeled 8EDTA-Zn2+ (green contours) and 8EDTA-Cu2+ (magenta contours) mutants with longitudinal 15N relaxation delays of 100 μs and 4 s, as indicated in the bottom left corner of each spectrum. The resonance assignments have been established previously,35 and cross-peaks are labeled according to the amide 15N frequency of the residue involved. d, Representative site-resolved 15N longitudinal relaxation trajectories for residues T51 and T53 in 8EDTA-Cu2+ and Zn2+. Experimental trajectories for 8EDTA-Zn2+ (green circles) and 8EDTA-Cu2+ (magenta circles) correspond to integrated cross-peak intensities in a series of 2D NCO spectra recorded as a function of the relaxation delay. Simulated best-fit trajectories to decaying single exponentials used to extract the longitudinal 15N relaxation rate constants are shown as solid lines of the corresponding color. The 15N PREs are calculated by taking the difference between the 15N R1 values obtained for the EDTA-Cu2+ and EDTA-Zn2+ proteins. e, Same as panel c for 28EDTA-Zn2+ (blue contours) and 28EDTA-Cu2+ (red contours). f, Same as panel d for residues Q32 and A48 in 28EDTA-Zn2+ (blue circles/lines) and 28EDTA-Cu2+ (red circles/lines).

