
Figure 3. Localization of FoxO1/3a and H. pylori infection.
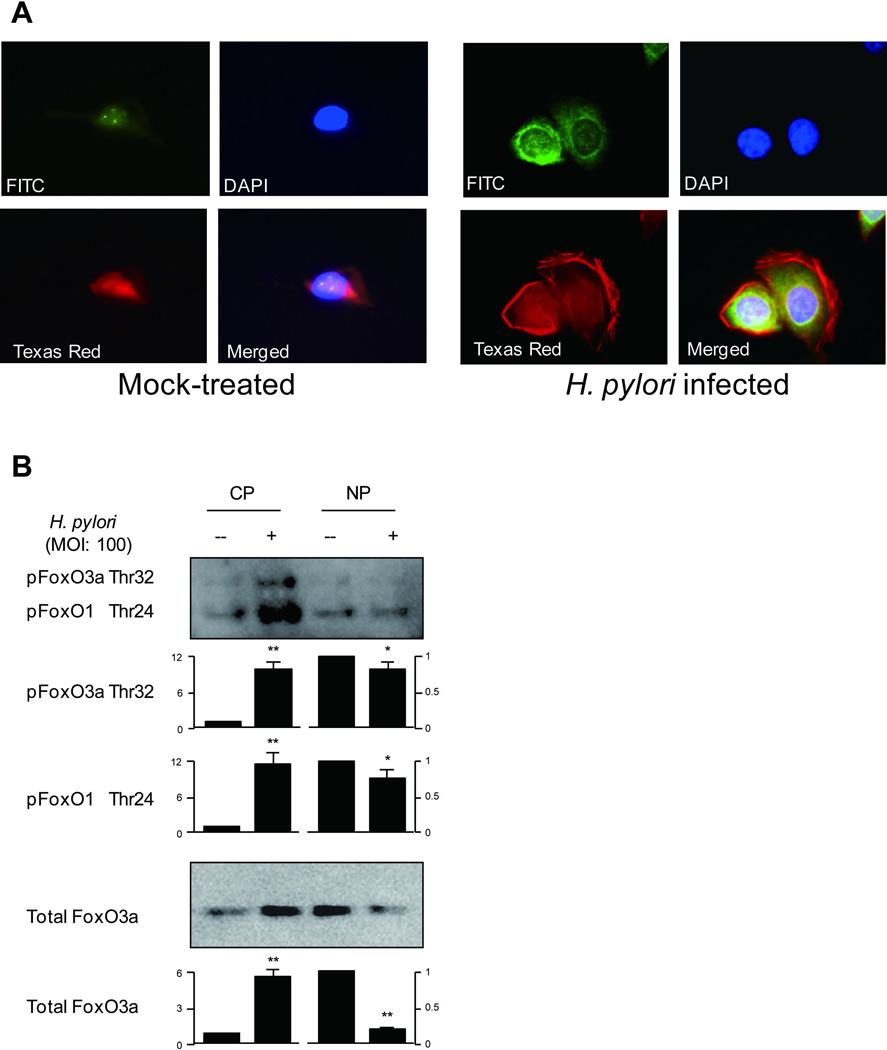
(A) AGS cells were mock-treated or infected with wild-type H. pylori (MOI of 100) for 30 min. Cells were incubated with phospho-specific FoxO3a Ser318/321 antibody followed by FITC-conjugated anti-rabbit IgG secondary antibody, Alexa Fluor 594 phalloidin, and DAPI to localize phosphorylated FoxO3a, F-actin, and the nucleus, respectively. Merged image was also shown. Cells were subjected to identical conditions for fixation, staining, and imaging. Images of each sample were taken in triplicate and we examined approximately 1,000 cells. Representative images are presented. The representative images shown in the right panel with H. pylori infection were in average observed in more than 80% of cells examined, as compared to in less than 10% of mock-treated cells.
(B) For Foxo1/3a subcellular distribution analysis, the cytoplasmic and nuclear proteins from mock-treated AGS cells or H. pylori infected for 1 hour were separated by SDS-PAGE analysis followed by immunoblotting with indicated antibodies. For quantitation, the density was normalized to that of β-actin for cytoplasm and Histone H1 for the nucleus. The levels were expressed as fold increase compared with those of mock-treated control cells. At least 3 independent co-cultures were performed. Data are presented as average values ± SE. * P < 0.05, ** P < 0.01 versus mock-treated control cells.
CP; cytoplasmic proteins, NP; nuclear proteins