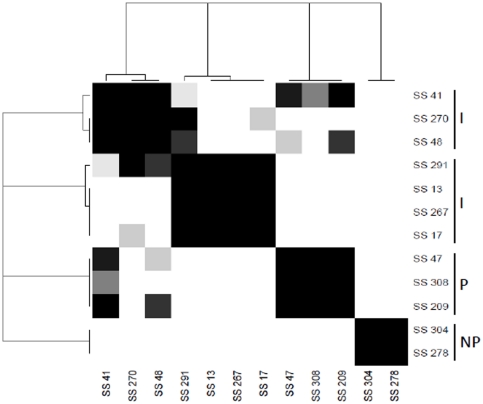
Figure 3. Statistical analysis comparing the cecal colonization levels of S. Senftenberg rifampicin-resistant strains in chicks.
Dendrogram and heatmap show the clustering of strains from a complete linkage as agglomerative algorithm and the distance matrix calculated by 1-p-values where p-values were obtained from comparisons of means of strain colonization levels during the period 19 to 26 or 33 days p.i and adjusted using Tukey's method for multiple comparisons. Strains belonging to the same black square are similar and significantly different from the other strains. I: intermediate strains, P: persistent strains, NP: non-persistent strains.

