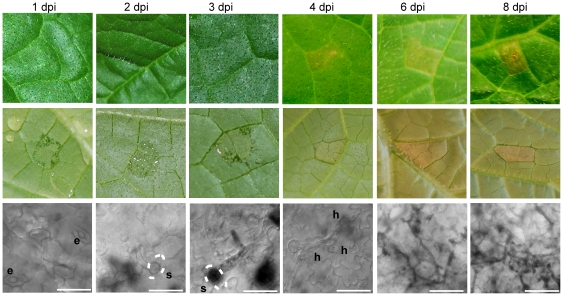
Figure 2. Symptoms and microscopy images of Pseudoperonospora cubensis infected Cucumis sativus cultivar ‘Vlaspik’ of time points used for transcriptome analysis.
Symptom images were collected of the adaxial (top row) and abaxial (middle row) at 1, 2, 3, 4, 6, and 8 days post-inoculation (dpi). Microscopy (bottom row) to assess stages of Ps. cubensis invasion were collected from the same time points using ethanol-cleared, trypan blue stained samples. Scale bars at 1–4 dpi are 25 µm. Scale bars at 6 and 8 dpi are 50 µm. Dotted lines represent position of stomata relative to the pathogen structure. e = encysted zoospore. s = stomate. h = haustorium.

