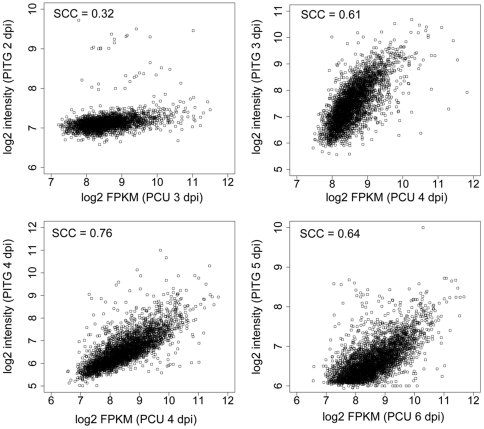
Figure 7. Comparison of ribonucleic acid sequencing (mRNA-Seq) and microarray expression patterns.
Microarray expression profiles were obtained from time course analyses of genes expressed in P. infestans (PITG) during infection on S. tuberosum [10]. Single copy orthologous genes between P. infestans and Ps. cubensis (PCU) were identified using OrthoMCL [60], [61]. Log2 transformed expression values of single copy orthologous genes present in both the Ps. cubensis (log2 of fragments per kilobase pair of exon model per million fragments mapped [FPKM]) and P. infestans (log2 intensity) datasets are shown as scatter plots. SCC Spearman correlation coefficient. dpi = days post-inoculation.

