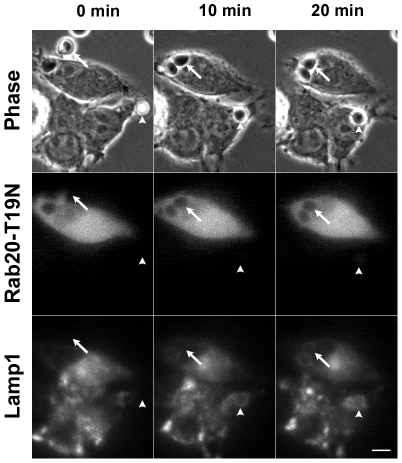
Figure 5. Time-lapse images showing different dynamics of Lamp1 between a Rab20-T19N-expressing cell and a non-expressing cell during ingestion of IgG-Es.
RAW264 macrophages co-expressing GFP-Rab20-T19N and CFP-Lamp1 were exposed to IgG-Es and observed by phase-contrast and fluorescence microscopy. The delivery of Lamp1 to formed phagosomes was inhibited in cells expressing Rab20-T19N (arrows) as compared to non-expressing controls (arrowheads). Similar results were obtained from four independent experiments. Scale bar: 5 µm. The corresponding video is Movie S5.

