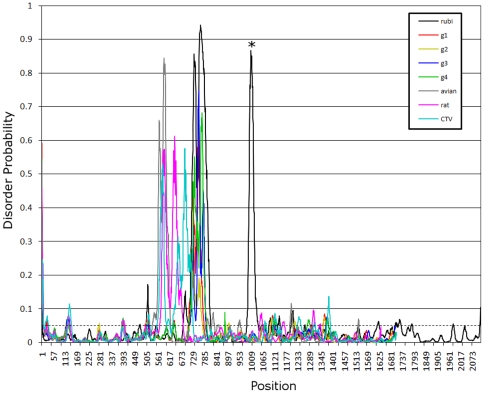
Figure 4. Disorder probability.
Disorder probability for aa sequence of selected sequences was calculated using DISOPRED2. A threshold value of 0.05 was set to distinguish between ordered and disordered region along the genome (dashed line). Regions above the threshold are predicted to be disordered (see table 1). All these viruses have a peak above 0.05 within their respective PPRs, positions 570 to 800. Rubivirus has two peaks, one in the PPR and the second at about position 1000, which is just upstream of the endopeptidase (denoted by the asterisk).

