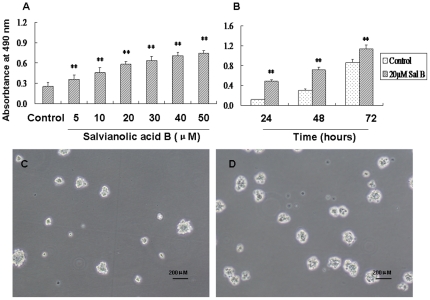
Figure 2. The promotive effect of salvianolic acid B on NSPCs proliferation.
(A) Sal B dose-dependently promoted NSPCs proliferation. (B) Sal B time-dependently promoted NSPCs proliferation. Data represent mean ± S.D. from three independent experiments. **Significant difference from the control group at P<0.01. (C–D) Representative microphotographs of formed neurospheres in the absence (C) or presence (D) of Sal B (20 µM). Sal B increased the size of formed neurospheres. Scale bars: 200 µm.

