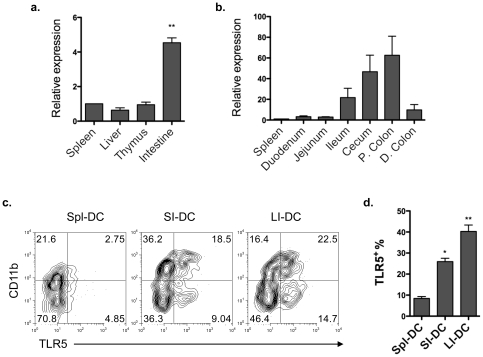
Figure 1. Lamina propria DCs, but not splenic DCs, express high levels of TLR5 protein.
(a) Quantitative real-time PCR of Tlr5 expression in the spleen, liver, thymus and intestine homogenates of C57BL/6 mice normalized to 18S mRNA expression. **P<0.01; compared to spleen. (b) Quantitative real-time PCR of Tlr5 expression in different intestinal fragments, including duodenum, jejunum, ileum, cecum, proximal colon (P. colon) and distal colon (D. colon), as compared to spleen Tlr5 expression. (c) TLR5 expression on splenic DCs (Spl-DC), small intestinal DCs (SI-DC) and large intestinal DCs (LI-DC) from pooled three mice was determined by flow cytometry. Plot numbers represent the percentage of CD11c+ cells in the respective quadrants. (d) Aggregate data of percentages of TLR5+ cells among CD11c+ cells. *P<0.05; **P<0.01; compared to splenic DCs. Data are aggregate (a, b, d; mean ± SEM) or representative (c) of three experiments, 2–3 mice for each experiment.

