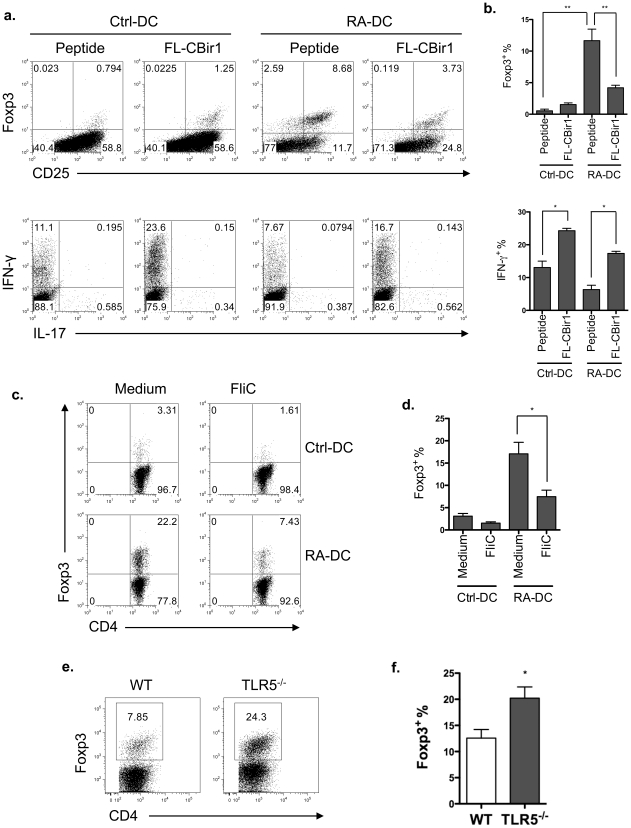
Figure 6. TLR5 ligation inhibits Foxp3+ Treg cell generation.
(a) 0.2×10⁵ CD4+ T cells from CBir1-Tg mice were cultured with control DCs or RA-DCs that were pulsed with full-length CBir1 flagellin (FL-CBir1) or CBir1 peptide. Five days later, T cell Foxp3 and cytokine expression were analyzed by intracellular staining. Plot numbers represent the percentage of CD4+ cells in the respective quadrants. (b) Aggregate data of Foxp3+ and IFN-γ+ T cells among total CD4+ T cells with mean ± SEM from three independent experiments. **P<0.01, *P<0.05 (c) CD4+ T cells from CBir1-Tg mice were cultured with CBir1 peptide pulsed-control DCs or RA-DCs in the presence of Salmonella flagellin FliC for 5 days. CD4+ T cell Foxp3 expression was analyzed by intracellular staining. (d) Aggregate data of Foxp3+ T cells among total CD4+ T cells with mean ± SEM from three experiments. *P<0.05 (e) Foxp3 expression of the lamina propria T cells from wild type and TLR5−/− mice was determined by flow cytometry. (f) Aggregate data of Foxp3+ T cells among total CD4+ T cells with mean ± SEM from three experiments. *P<0.05. Flow cytometry data (a–c) are representative of at least three experiments. For Figure 6a–d, bone marrow cells were isolated from one wild type mouse; naïve CD4 T cells were isolated from one CBir1-Tg mouse. For Figure 6e–f, lamina propria T cells were isolated from a pool of 2–3 wild type or TLR5−/− mice, respectively.

