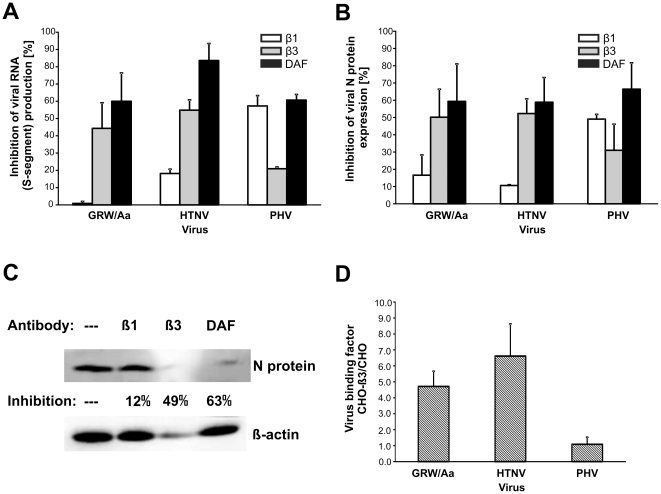
Figure 2. Determination of DOBV GRW/Aa receptor usage by receptor blocking assays (A–C) and receptor binding experiment (D).
Vero E6 cells were treated with 40 µg/ml of indicated blocking antibodies for 1 hour. Then virus at multiplicity of infection 0.05 was added to the cells. After one hour cells were washed and new medium was added. One day later samples were collected. A) Viral S-segment RNA was measured by qPCR. B) Expression of viral nucleocapsid (N) protein was detected by Western blot. The density of bands on blots was quantified by ImageJ 1.41o programm (Wayne Rasband National Institutes of Health, USA). The percentages of antibody-mediated inhibition of viral infection were calculated in comparison to untreated but infected cells. Experiment was performed three times. Data are presented as the mean ± SD of the mean. C) Representative picture of the Western blot analyses summarized in part B. —, untreated cells; β1, cells pre-treated with β1 integrin specific monoclonal antibody (MAb); β3, cells pre-treated with β3 integrin specific MAb; DAF, cells pre-treated with DAF specific MAb. D) Binding of GRW/Aa to CHO cells stably expressing β3 integrins (CHO-β3cells) in comparison to control CHO cells. Virus binding was performed at 4°C for 1 hour. HTNV and PHV were used as controls. The amount of bound virus was measured through detection of viral RNA by specific qPCR. The binding affinity of virus particles to CHO-β3 cells is expressed as a ratio between virus genome equivalents detected on CHO-β3 cells and on the control CHO cells. Error bars represent standard deviations of the means from three experiments.

