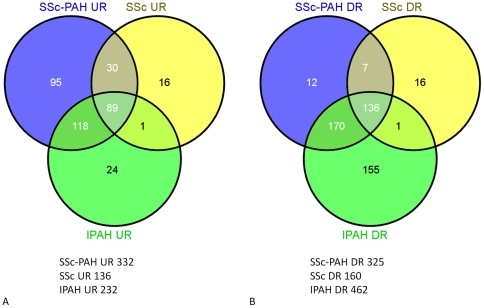
Figure 1. Venn diagrams illustrating the distribution of statistically significant disease-specific changes in gene expression.
A) up-regulated and B) down-regulated gene expression for comparisons between SSc, SSc-PAH, and IPAH patients versus healthy controls. Total number of calculated differentially expressed genes for each comparison are as indicated below each diagram.

